

🌐 We’re running out of room for data centres
PLUS: Taming foundation models, why chatbots make terrible drivers, and more.

Hey guys, here’s this week’s edition of the Spatial Edge — a newsletter that was named by the same folks who named GPT-5.4 (Thinking) High. In any case, the aim is to make you a better geospatial data scientist in less than five minutes a week.
In today’s newsletter:
Data Centres: New maps show remaining US capacity.
SAM3 Fixes: CONCEPTBANK improves segmentation under domain drift.
Spatial AI: Why chatbots still struggle to drive.
Health Mapping: AI links imagery and demographics.
WorldPop 2: New global population grids at 100 metres.
Research you should know about
1. We’re running out of room for data centres
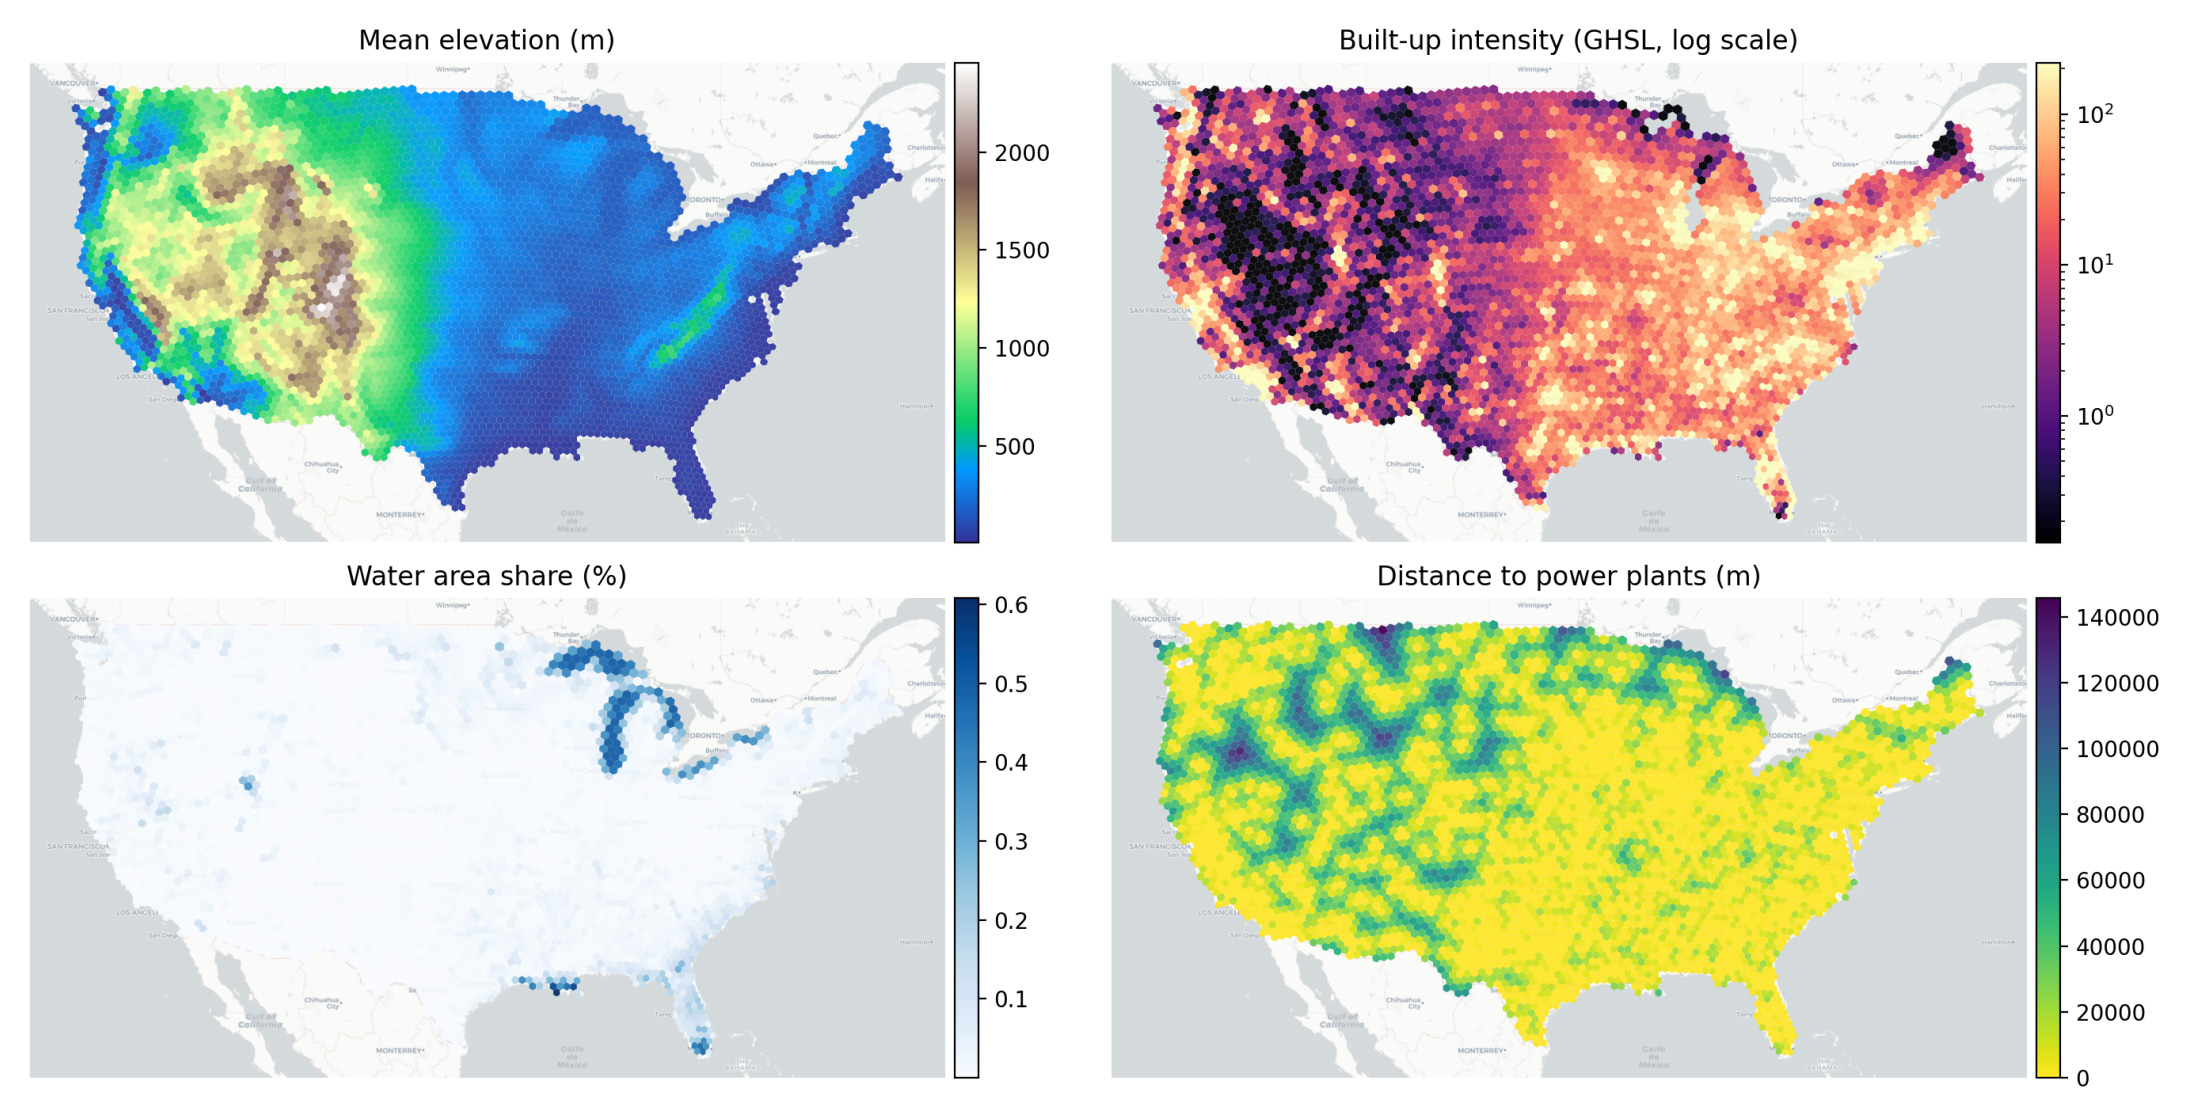
The recent generative AI boom is driving a massive expansion of hyperscale data centres across the United States. While we have plenty of maps showing where these facilities are currently located, a new study takes a different approach by looking at where they can actually still be built. Rather than relying on future demand forecasts or basic zoning laws, the researcher built a constraint-first geospatial framework. This means they focused entirely on the strict physical, environmental and infrastructural limits that dictate where a massive server farm can realistically operate today.
To map this out, this new study divided the country into a uniform hexagonal grid and analysed the precise characteristics of existing hyperscale sites. The models layered in a huge amount of spatial data, including high-voltage power transmission lines, local substations, summer temperature peaks, flood risks and built-up land density. By using unsupervised machine learning approaches to compare these data layers against the environments of current facilities, the analysis identified remaining regions that share the specific structural DNA needed to support new development.
The findings suggest that the US is facing a pretty tight ceiling when it comes to future hosting capacity. Both models converged on a surprisingly limited envelope of feasible land, estimating that the total physically viable capacity left is somewhere in the tens of gigawatts (roughly 25 to 100 GW), rather than the hundreds of gigawatts that some optimistic industry forecasts assume. Ultimately, this shows that the tech industry is running out of easy real estate. Exceeding this physical limit will require a fundamental overhaul of the underlying electricity system and local regulatory landscapes.
2. Taming foundation models for the real world
The recently released SAM3 model has been pretty massive for text-to-segmentation. As with the other SAMs, it allows users to segment almost anything just by typing a text prompt. However, when you take it out of its comfortable pre-training environment and deploy it in the wild, things start to break down. The main culprits are data drift and concept drift. Data drift happens when the actual visual statistics shift, which is a pretty big issue in remote sensing where aerial viewpoints and spectral signatures look nothing like standard photos. Concept drift occurs when the meaning of a label changes depending on the context (like how the word “mouse” means an animal in a nature dataset but a clicking-device-thingy in an office dataset). When these shifts happen, the model’s static text prompts no longer align with the visual evidence, leading to missed objects and incorrect masks.
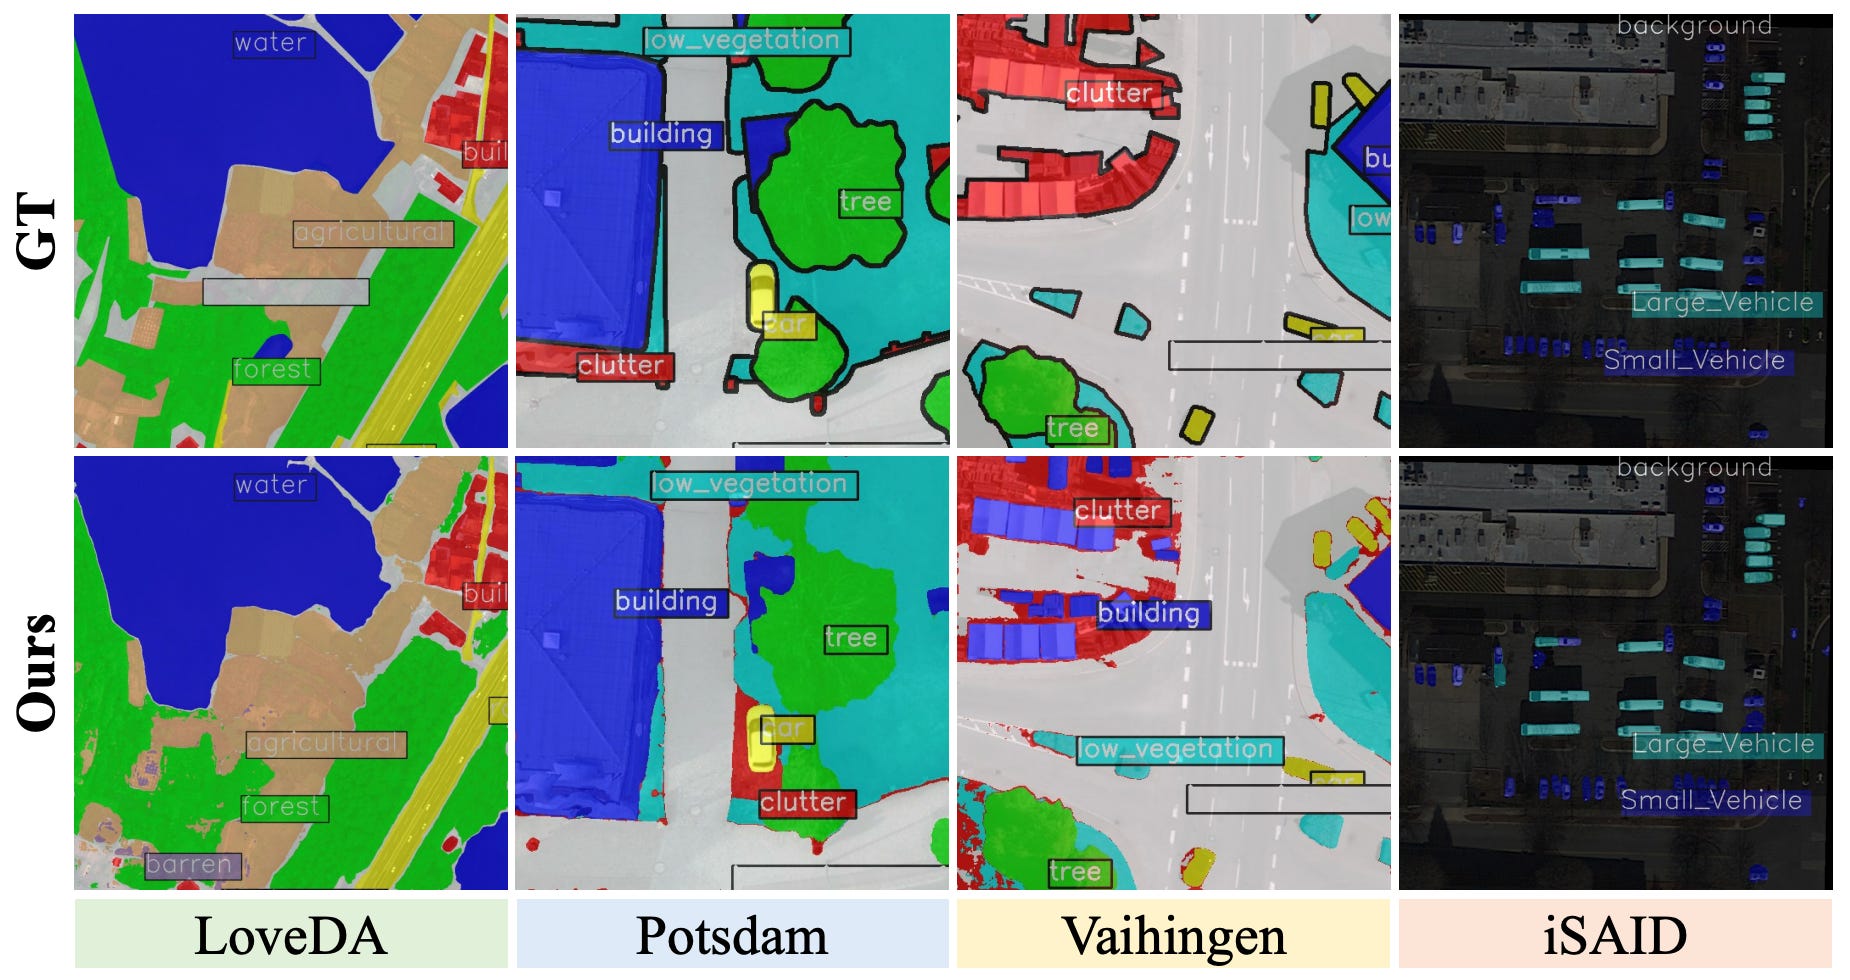
To fix this without the massive computational headache of retraining the whole model, researchers have proposed a parameter-free framework called CONCEPTBANK. Instead of relying on static text prompts, this system builds a dataset-specific dictionary derived directly from the target domain’s actual statistics. It works through a clever three-stage pipeline. First, it anchors target evidence by finding visual prototypes for each class. Second, it filters out noisy outliers to ensure it is only looking at representative examples. Finally, it uses a large language model to generate a variety of synonyms and attribute descriptions, fusing the best ones together to create a calibrated text anchor that perfectly matches the target dataset. It does all of this on the fly without updating a single weight in the SAM3 backbone.
The results are quite compelling, especially for those of us working with geospatial data (which I’m guessing is you). When tested across four different remote sensing benchmarks, CONCEPTBANK boosted SAM3’s average performance by 13 percentage points compared to the vanilla version. Datasets like LoveDA and iSAID, which usually trip up standard models due to their complex aerial perspectives, saw huge improvements. It also performed exceptionally well on standard natural scene datasets. Because the system bypasses the text encoder during actual inference and just retrieves the pre-calibrated anchors, it actually speeds up the processing time by 25 per cent. Ultimately, this approach provides a highly robust, plug-and-play way to optimise massive foundation models for messy, real-world satellite imagery.
3. Why chatbots make terrible drivers
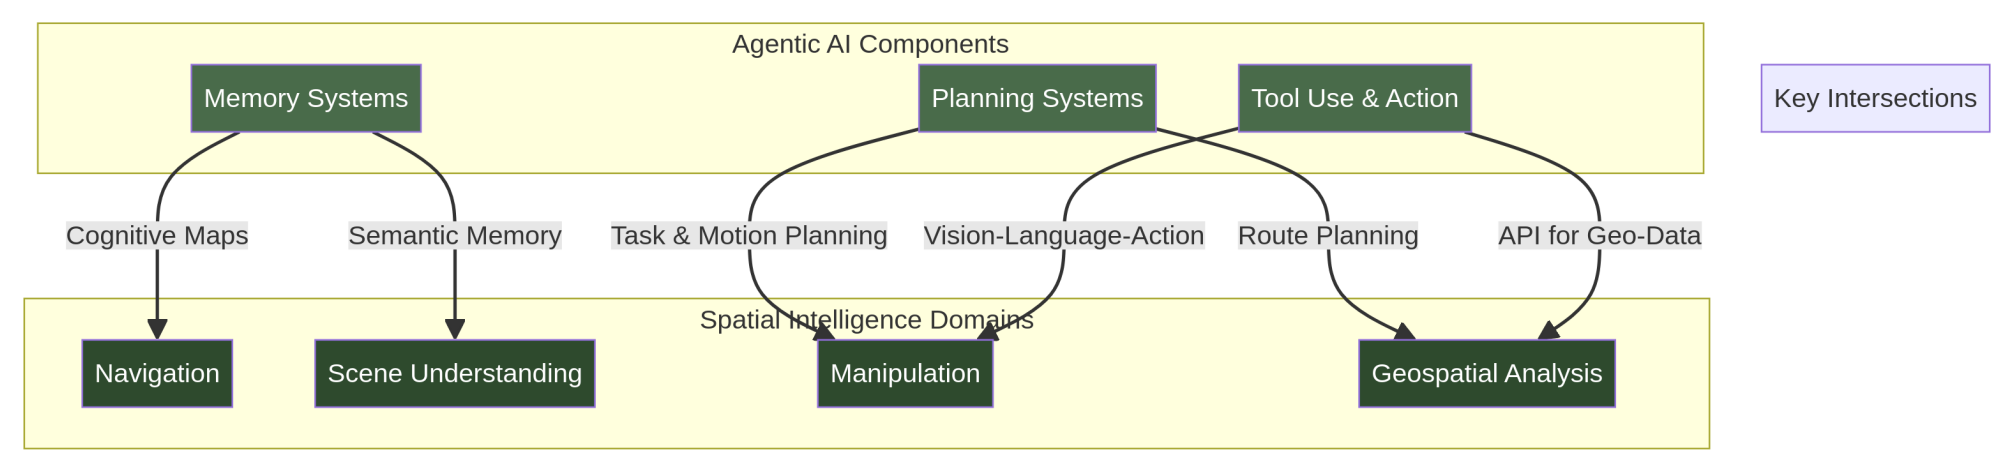
LLMs are great. And I’m sure many of you are like me - our best friends are an LLM, like my OpenClaw Billy. But LLMs have historically failed when navigating the physical world. A model that can perfectly describe a photo of a kitchen cannot necessarily figure out how to move through it or pick up a mug. This happens because these models lack ‘spatial grounding’, which is the metric understanding of geometry and physics required to turn perception into action. To solve this disconnect, a team of researchers reviewed over 2,000 papers to create a massive new taxonomy that connects standard AI agent capabilities with spatial intelligence.
Their framework divides the landscape into three axes: the specific spatial task, the agent’s cognitive capabilities, and the physical scale. When mapping existing research onto this grid, they discovered a pretty big imbalance. Roughly 68 per cent of current methods focus on ‘meso-spatial’ tasks like room-scale navigation, leaving micro-scale robotic manipulation and macro-scale geospatial analysis completely underexplored. To bridge these gaps, the authors highlight some promising architectural patterns, specifically integrating Graph Neural Networks with language models. This helps agents maintain a structured, persistent understanding of spatial relationships over time rather than relying on text alone.
Another major takeaway is the absolute necessity of ‘world models’ for safe physical deployment. Since physical mistakes can cause irreversible damage, agents need these internal simulators to predict the consequences of their actions before actually making a move. Looking ahead, the researchers pinpoint several grand challenges that stand in the way of truly autonomous spatial systems. The most glaring issue is the lack of unified cross-scale representation, meaning an AI struggles to seamlessly transition from planning a city-wide route down to the centimetre-level precision needed to open a door. Solving these structural barriers will be essential for the next generation of robotics and autonomous vehicles.
4. Mapping public health from space
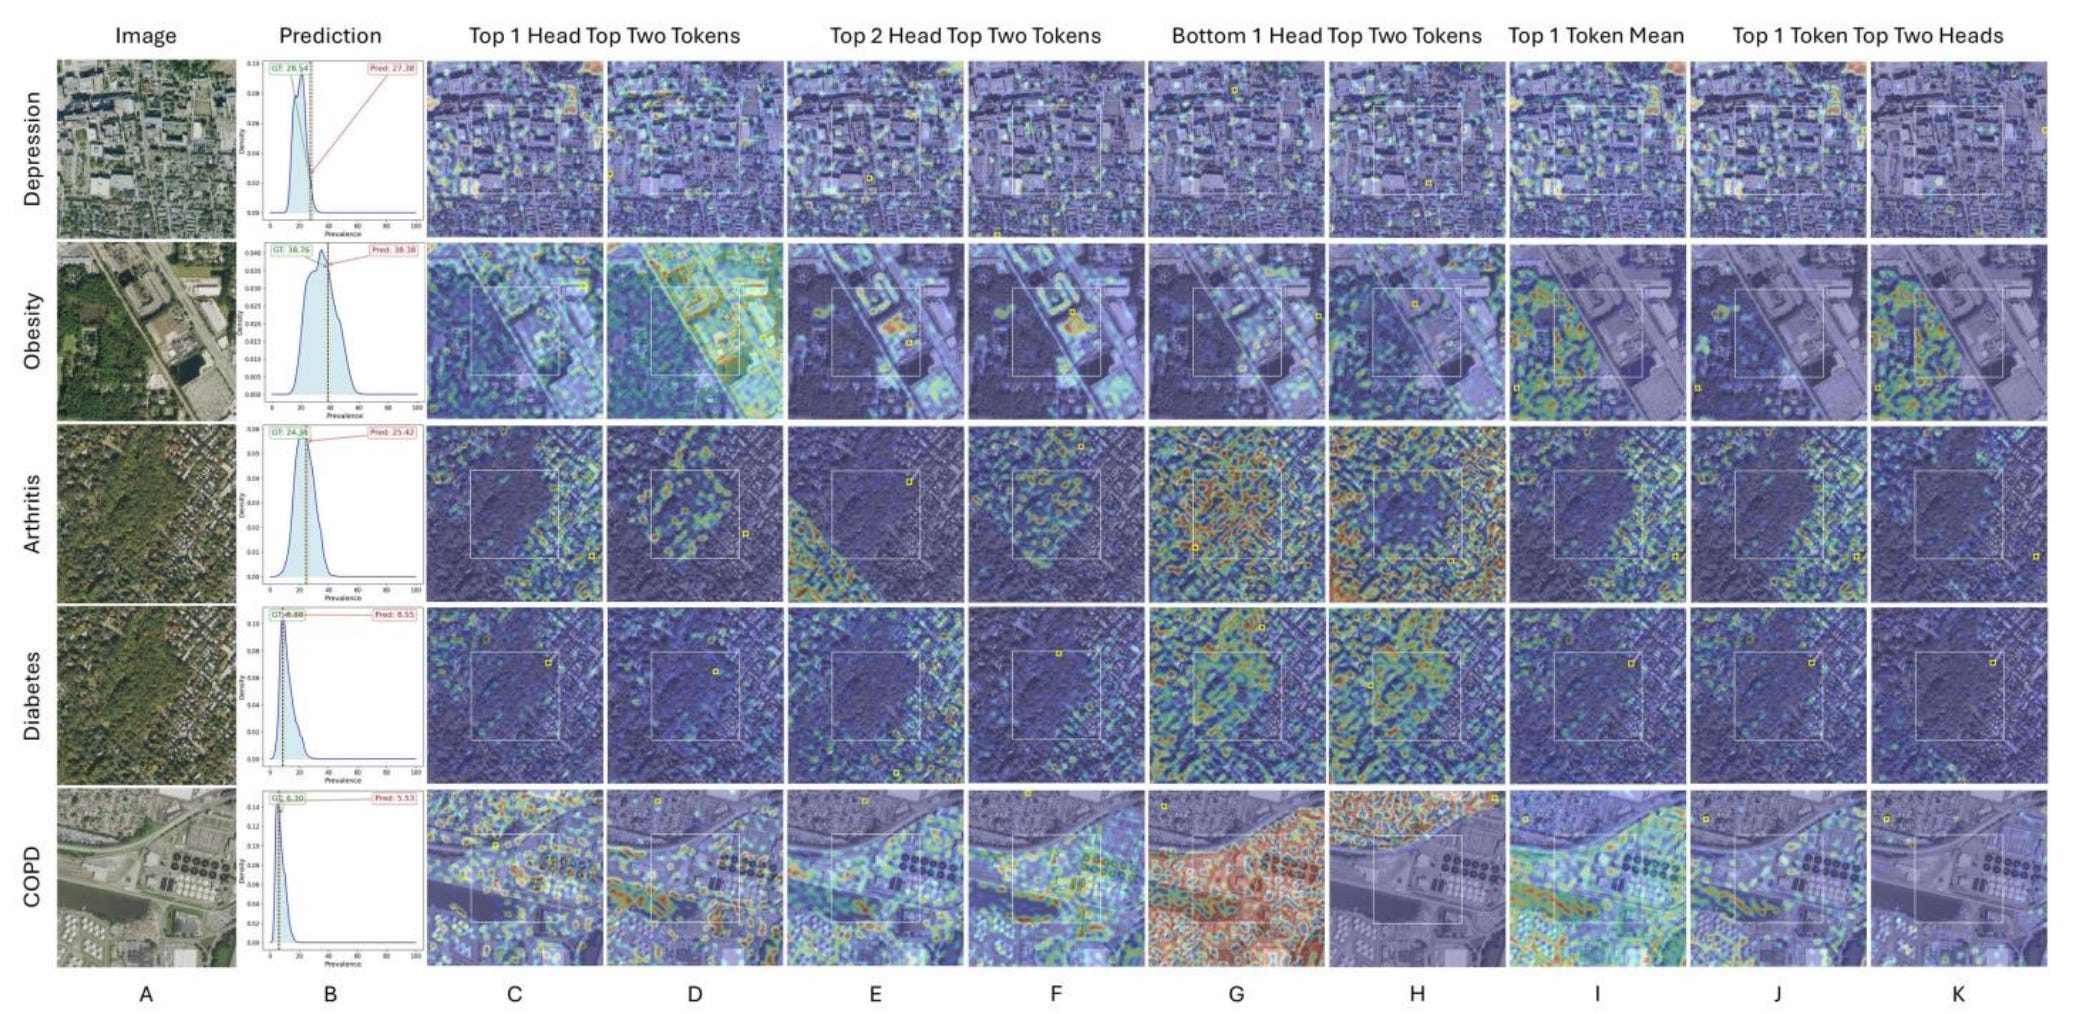
Predicting public health outcomes usually requires massive amounts of census and medical data. Satellite imagery can show us the physical environment, like green spaces or industrial zones, but it misses crucial demographic context. To bridge this gap, researchers have developed a new AI model called the Geo-Context Guided Visual Transformer (GCGVT). Instead of just merging data blindly, it uses a ‘Guided Attention’ mechanism. This allows the model to look at an aerial view of a neighbourhood while being explicitly guided by specific socioeconomic factors, pointing the AI to the most relevant physical features.
The team tested their model on predicting the prevalence of nine chronic diseases, including diabetes, obesity and depression, across 14,330 historical redlining zones in the US. They fed the AI aerial photos alongside 228 variables from the American Community Survey, covering details like age, income and race. The new model achieved an impressive average predictive score of 0.85, completely outperforming standard vision-language models like CLIP. Interestingly, the researchers found that they did not need all 228 variables. By combining the aerial imagery with just two demographic categories, such as Income and Race for predicting obesity, or Age and Housing for arthritis, the model still delivered highly accurate forecasts.
The real breakthrough here is the transparency of the system. Most deep learning models operate as a black box, making them hard to trust in healthcare settings. However, this framework assigns different AI attention heads to specific demographic categories, allowing users to see exactly how the model connects the dots. For instance, when predicting depression rates, the model visually highlighted how employment data correlated to specific housing blocks, and how education levels mapped onto nearby natural areas. This gives public health officials a highly interpretable tool to map out health disparities without relying on exhaustive, expensive on-the-ground surveys.
Geospatial Datasets
1. WorldPop Global 2 dataset

The newly released WorldPop Global 2 dataset provides highly detailed, annual geospatial population estimates at a 100-metre resolution for over 240 countries and territories, spanning the years 2015 to 2030. Built using recent census information and satellite-derived settlement modelling, this open-access resource also provides age and sex breakdowns. You can access the data here.
2. Long-term night-time light dataset

The Extended VIIRS-like Artificial Nighttime Light (EVAL) dataset provides a continuous, high-quality annual record of night-time illumination across China from 1986 to 2024. Using a two-stage deep learning framework, this 500-metre resolution map resolves common issues found in older satellite records, such as the underestimation of brilliant city centres and the blurring of intricate road networks. You can access the data here and the code here.
3. Impervious surface cover dataset

The China Impervious Surface Cover (CISC) dataset provides a 30-metre resolution map of artificial surfaces across mainland China for 2020 and 2022. It fuses together high-resolution 2-metre imagery from the Gaofen satellite series with 30-metre Landsat and SRTM data via a regionally adaptive deep learning model. You can access the data here and the code here.
4. Bioavailable strontium isotope data

If, unlike me, you’ve heard of bioavailable strontium isotopes, then you’re in luck. This compilation harmonises over 28,000 bioavailable strontium isotope (87Sr/86Sr) data points from more than 150 countries into one easily accessible resource. It draws from decades of research across soil, water, flora, and fauna samples. You can access the data here and here, and the code here.
Other useful bits

The European Space Agency has just launched the EOPF Sentinel Zarr Explorer, a new platform that shifts massive Earth observation datasets into a new (and different) cloud-native format. This means we can now discover, visualise, and analyse satellite imagery directly in their web browsers without the headache of downloading colossal files.
Researchers have just released PyGALAX, a new open-source Python toolkit designed to take the headache out of complex geospatial machine learning. By combining automated modelling with explainable AI, it gives users a much clearer picture of the 'why' behind spatial patterns, making it a fantastic resource for everything from urban planning to environmental monitoring.
A new tool called the Interpretable Code-based assistant for Earth Observation (IC-EO) is making satellite data analysis accessible by translating simple, natural language questions directly into Python code. Developed by researchers alongside the European Space Agency, it allows even non-experts to tackle complex tasks like wildfire assessments and land-use mapping with impressive accuracy and transparency.
Google Earth is tackling the headache of city gridlock by letting urban planners import their own custom traffic data directly onto the globe. By mixing this with built-in layers like vehicle trip counts and signal performance, it provides a new way of pinpointing bottlenecks.
Jobs
Mapbox is looking for a Technical Support Engineer based in China
UNEP - United Nations Environment Programme is looking for a Spatial Data Application Developer based in Nairobi, Kenya
International Water Management Institute (IWMI) is looking for a Senior Geospatial Data Engineer based in Colombo, Sri Lanka
Just for Fun

This map outlines the European Union's envisaged transport and trade corridors across Africa.
That’s it for this week.
I’m always keen to hear from you, so please let me know if you have:
new geospatial datasets
newly published papers
geospatial job opportunities
and I’ll do my best to showcase them here.
Yohan