

🌐 What geospatial data and Gaudí can tell us about our taste in art
PLUS: NASA's new approach to detecting methane, detecting oil spills using AI, and more.

Hey guys, here’s this week’s edition of the Spatial Edge. It’s the place where you come to learn about coordinate reference systems, but instead you end up reading about Gaudí and my (lack of) artistic taste. In any case, the aim is to make you a better geospatial data scientist in less than five minutes a week.
In today’s newsletter:
Gaudí Buildings: Look more like nature than glass towers.
Methane Detection: New AI model spots leaks from space.
Fire Risk: ERA5 underestimates wildfire danger in Sweden.
Oil Spills: Deep learning maps 1,500 spills near Suez.
Landsat Models: New benchmark suite tests foundation model performance.
Research you should know about
1. Gaudí 1, Glass Boxes 0

I’ve had the pleasure of visiting Barcelona several times and checking out the architecture of Antonio Gaudí. I must admit, my first reaction is usually, “that looks weird”. Well apparently I’m an idiot, because the most common reaction people have is: “that looks organic and nature-inspired”.
And to really drive home the message of my idiocy, a bunch of researchers from Uppsala analysed images of Gaudí’s architecture in Barcelona and compared them to both natural landscapes and modern buildings from the same neighbourhoods. They found that Gaudí’s buildings have an average amplitude spectrum slope (a measure of visual detail distribution) that is much closer to that of natural scenes than to modern structures. Around a third of Gaudí’s buildings fell into the “natural” slope range of 1 to 1.2. None of the contemporary buildings did.
The team also measured image entropy, which captures how visually unpredictable or information-rich a scene is. Gaudí’s buildings showed higher entropy than the modern buildings, which means they offer more complex visual stimuluses (or is it stimuli?)… Anyway, I guess this makes sense given his use of textured materials, curved shapes, and asymmetrical designs. Images of contemporary buildings appeared more uniform and predictable. Interestingly, adding trees in front of those same modern buildings increased both their entropy and their resemblance to natural visual patterns.
You can get the data and code from here.
2. Detecting methane leaks from space just got a lot easier
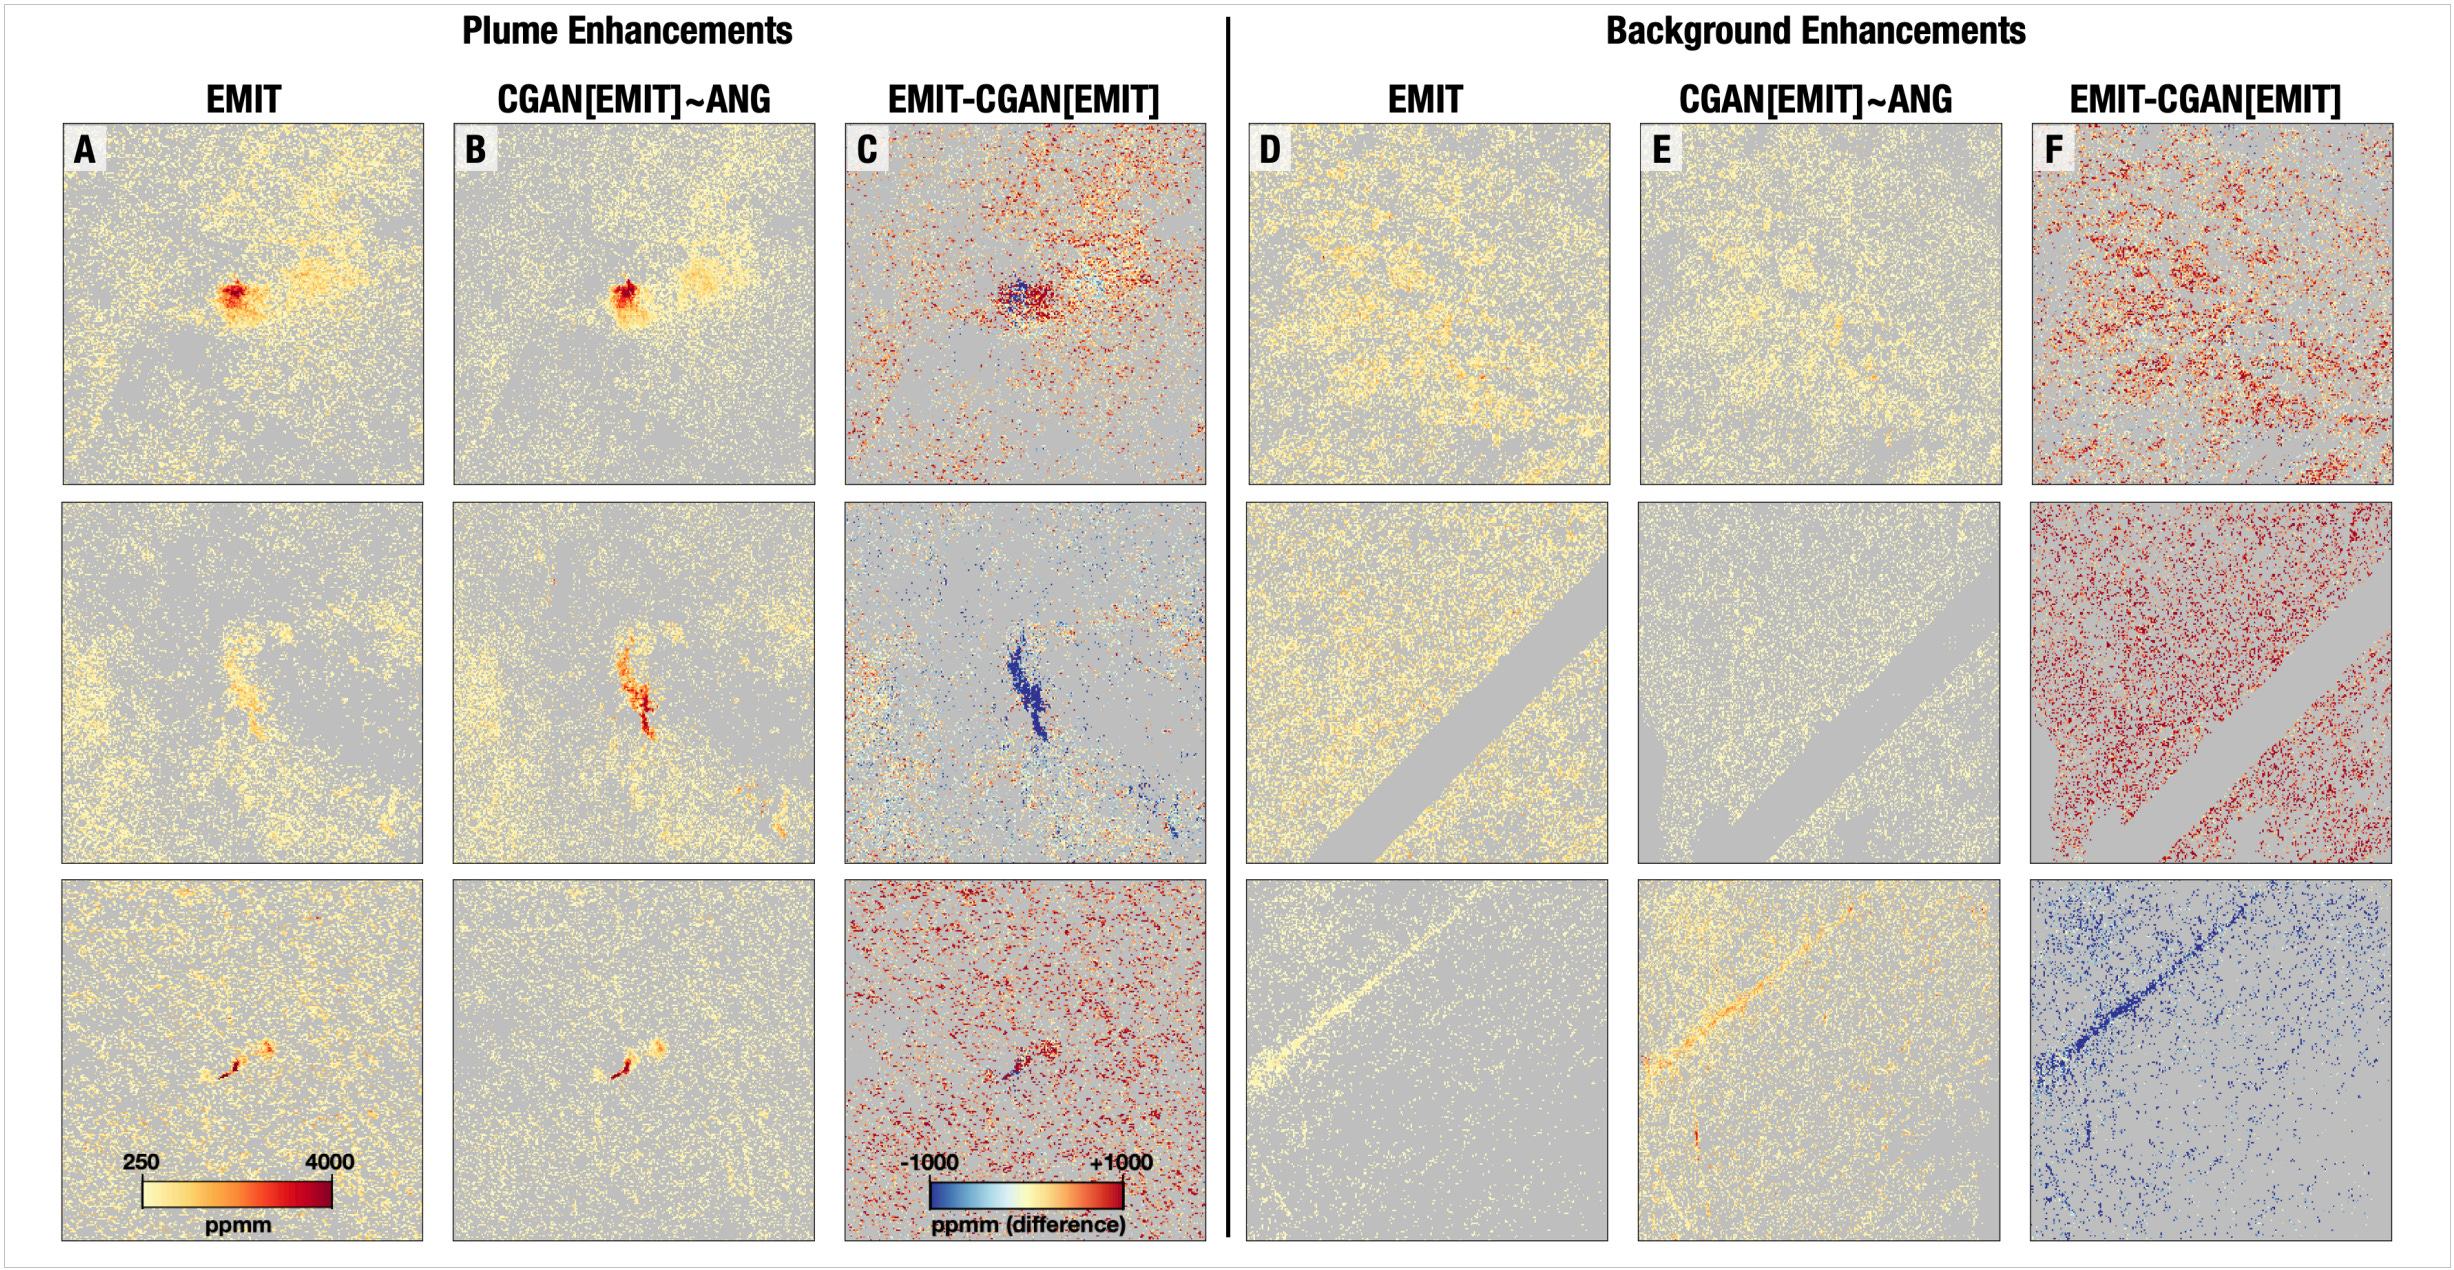
If, in your past time, you enjoy monitoring Methane, then you’ll probably know that Methane plumes can now be spotted from satellites. This is done using NASA’s EMIT sensor. However, training machine learning models to detect them is still pretty tricky. Most labelled plume data still comes from high-resolution airborne campaigns like AVIRIS-NG. The problem is that models trained on airborne data don’t transfer well to satellite imagery because of differences in resolution, noise, and scene complexity.
A new study from researchers at MIT and NASA’s Jet Propulsion Lab tackles this challenge using two strategies:
model adaptation (fine-tuning existing models) and
data adaptation (translating data between sensor domains using GANs).
The model adaptation approach showed promising results. By gradually unfreezing deeper layers of an airborne-trained convolutional neural network and refining it using satellite (EMIT) data, performance jumped from an F1 score of 0.52 (zero-shot) to 0.76. Even more interesting: this fine-tuned model slightly outperformed a model trained on EMIT data alone. This suggests that airborne data, if used correctly, can actually improve spaceborne detection, especially when only limited satellite training data is available.
But the most impressive gains came from data adaptation. The researchers used CycleGAN to map airborne imagery into the satellite domain and vice versa. This is a type of neural network that learns to translate between two image domains without paired training data. This allowed them to simulate what a satellite would “see” based on high-res airborne data. When they passed these translated images through their existing classifier, the F1 score reached 0.88 (far better than either direct or fine-tuned models). This shows that domain translation can bridge sensor gaps and may be pretty important to scale up methane monitoring from space.
3. Reanalysis data is underestimating fire risk in Europe

Fire danger is rising across Sweden, and reanalysis datasets are underestimating the risk. Using 70 years of daily weather observations from nine stations across the country, a new paper in Scientific Reports found that peak fire danger has increased by 18 percent since 1951. The rise is mostly driven by higher midday temperatures, which dry out surface fuels by lowering relative humidity. While the northernmost site showed no clear trend, all other locations in the 1100 km north to south transect showed a rise. The biggest increases occurred in the early fire season, especially in May and June, with some sites also seeing a shift in the timing of peak fire danger.
The study compared fire danger derived from observations with ERA5 reanalysis data. For moderate to high fire risk (FWI above 5), ERA5 underestimated values by around 25 percent on average. The gap widened for more extreme conditions, with ERA5 values falling short by up to 8 points. This bias comes from ERA5 smoothing out temperature, wind, and rainfall across grid cells, which means it cannot fully capture local extremes. As a result, it underestimates fire danger during the periods when accurate readings matter most.
Reanalysis datasets like ERA5 are widely used to monitor and forecast fire danger, but these results show that can sometimes miss the mark. While ERA5 remains useful for regional analysis, its performance drops when estimating fire danger at the site level or during peak events.
You can access the data here.
4. A new deep learning model just mapped 1,500 oil spills

The northern entrance of the Suez Canal sees thousands of ships pass through each year, and with them comes a growing risk of oil spills. A new study from researchers at Cairo University tests whether AI can help monitor these oil spills using radar satellite images. Researchers trained a deep learning model (DeepLabv3+) on Sentinel-1 SAR data to automatically detect oil spills. They compared two versions of the model: one trained on European spill data, and another on a new dataset of 1,500 local oil spills in Egyptian waters. The locally trained model performed better, especially in identifying larger spills and matching the real-world spill area.
The Egyptian-data-trained model reached 98 percent accuracy and came much closer to capturing the actual spill size. In contrast, the European-data model consistently underestimated spill areas, sometimes by over 100 square kilometres. The reason is that oil spills vary across regions depending on weather, water conditions, and how the oil spreads. A model trained on local data picks up on these subtle patterns. This makes it more useful for real-time response, especially in a place like the Suez where quick action is critical.
The top-performing model used freely available satellite data and ran on cloud-based infrastructure, which keeps costs low and makes it scalable. Sentinel-1 images are available within a few hours of capture, and the automated system can process them in near real time. While the model still struggles with thin spills and sometimes over-predicts in complex cases, it shows that there’s just about nothing that SAR and AI can’t do when they work together…
Geospatial Datasets
1. Sea level observation dataset

A new dataset offers high-frequency sea level observations from 27 low-cost pressure sensors deployed off the coast of Le Conquet, France, during winter 2023–2024. You can access the data here and the code here.
2. Landsat benchmark dataset
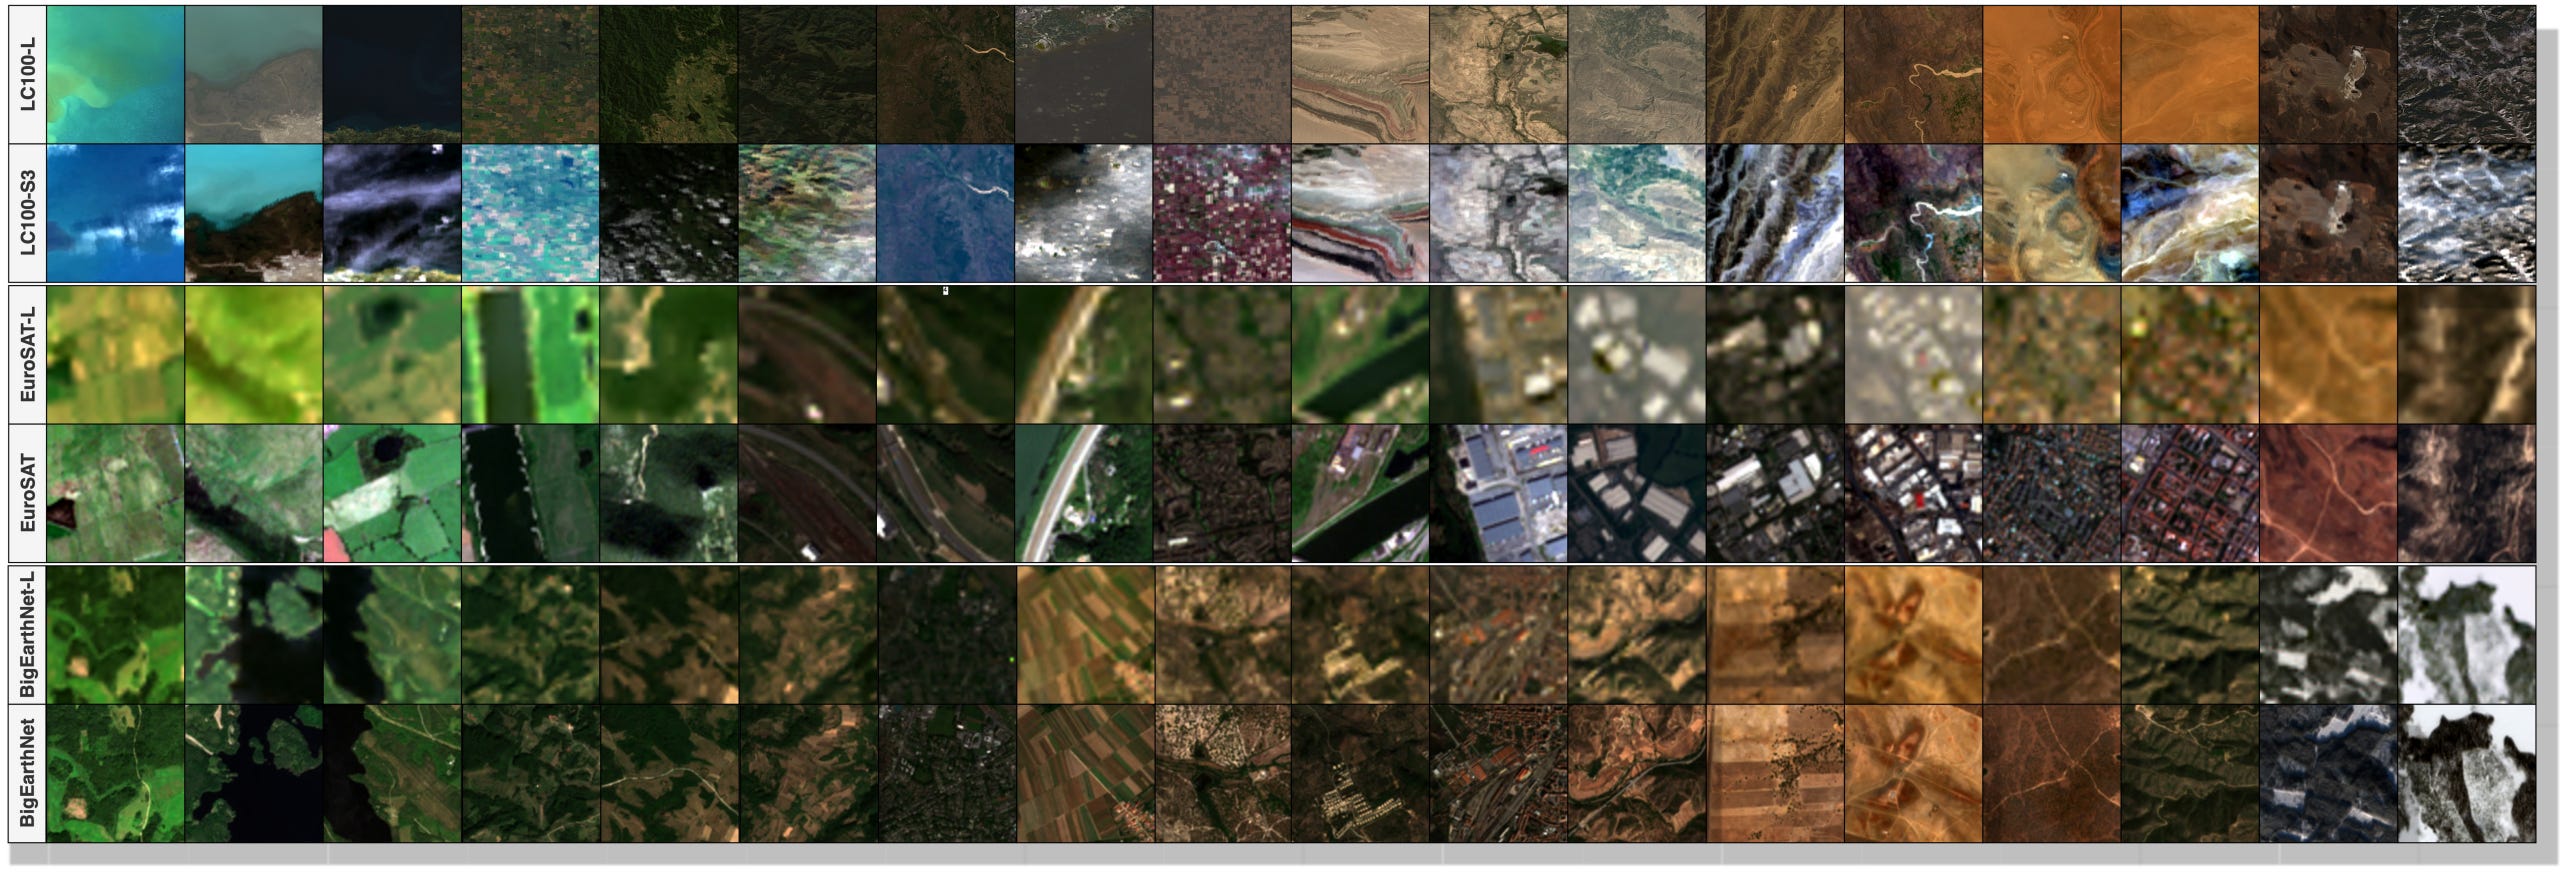
Landsat-Bench is a new benchmark suite designed to evaluate foundation models trained on Landsat imagery. You can access the data and code here.
3. Agricultural potential dataset
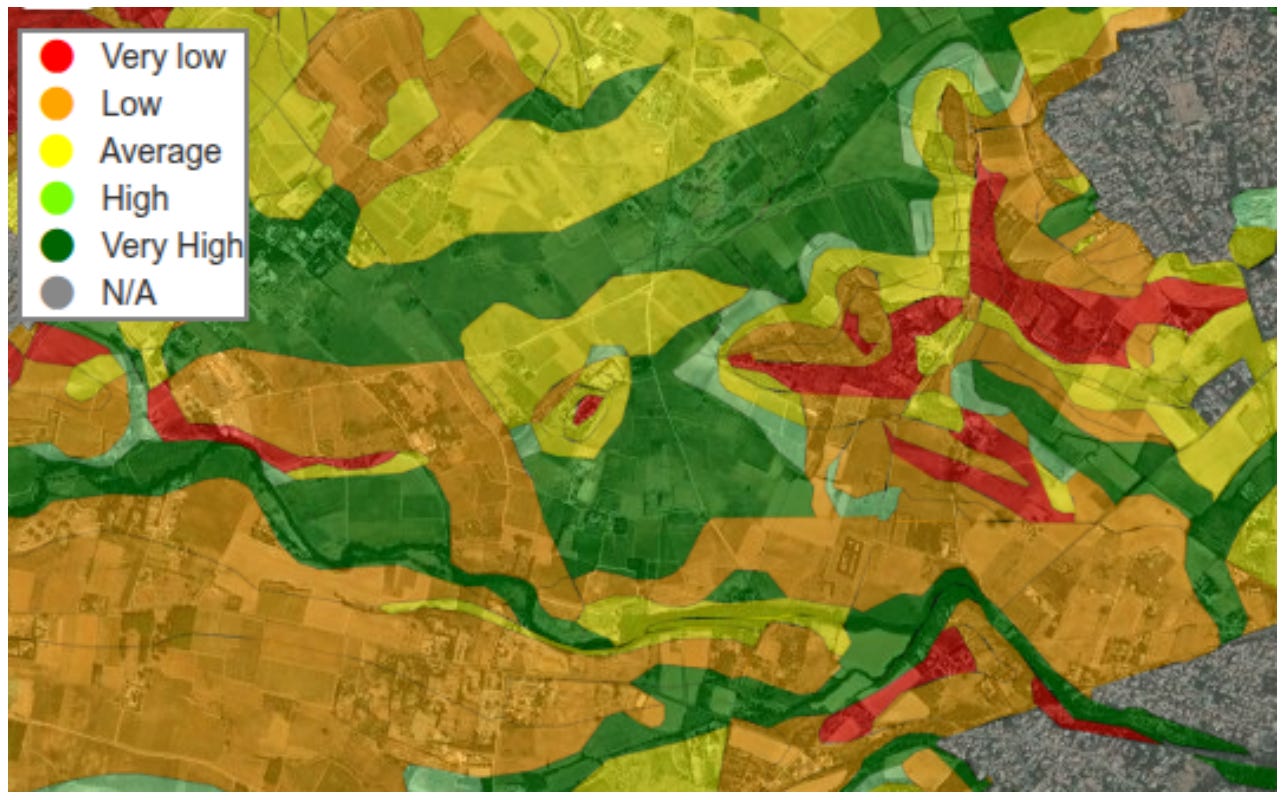
AgriPotential is a large, multi-spectral and multi-temporal remote sensing dataset designed to predict agricultural potential for viticulture, market gardening, and field crops in Southern France. It contains 8,890 patches of Sentinel‑2 imagery grouped into five potential classes. You can access the data here and the code here.
4. Rice distribution dataset

GCD-Rice is a long-term paddy rice distribution dataset for Asia, covering 1990 to 2023 at a fine 30 m resolution. It maps rice fields across three growing seasons in 16 countries, combining Landsat, Sentinel-1, and a phenology-driven machine learning pipeline. You can access the data here and the code here.
Other useful bits
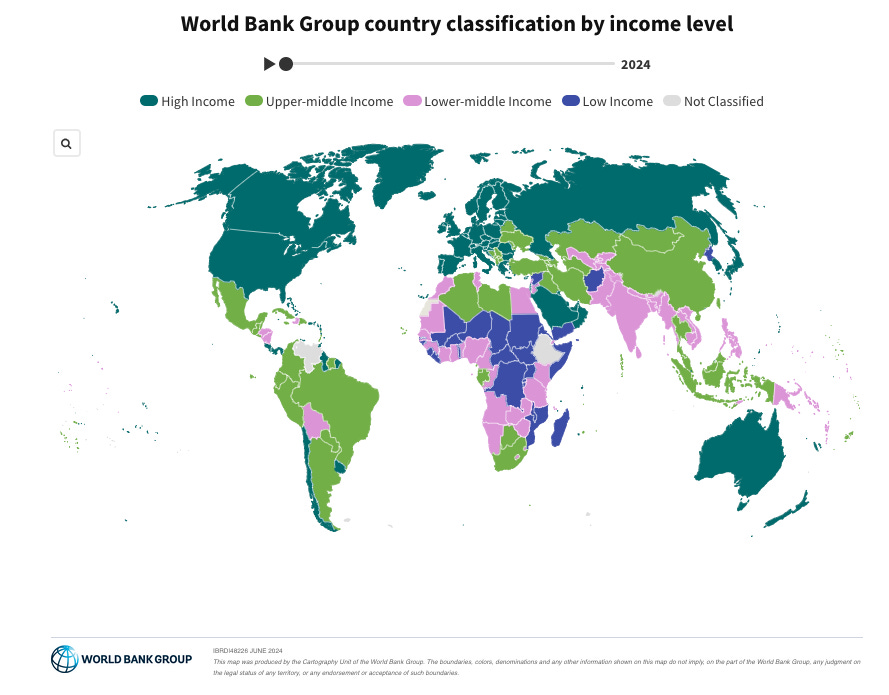
The World Bank has released its latest country income classifications for FY26, showing how changes in GNI per capita have moved several countries up or down the income ladder. The most notable shifts for FY2026:
• Costa Rica → high income
• Cabo Verde → upper-middle
• Samoa → upper-middle
• Namibia → down to lower-middle
Europe’s new hypersonic test vehicle, INVICTUS, is being developed by ESA and UK-based Frazer-Nash to explore reusable, high-speed flight.
MethaneSat, a NASA-backed satellite, was designed to detect invisible methane leaks from oil fields, farms, and landfills. With the satellite now offline, scientists warn it’ll be harder to track methane emissions, especially in countries without access to aircraft surveys or commercial satellite data.
Jobs
UNHCR is looking for a Senior Data Management Associate based in Toronto.
IMPACT Initiatives is looking for a Senior GIS Officer based in Geneva.
Development Seed is looking for a (1) a Geospatial and AI tools Engineer and (2) a Frontend Engineer based in an ESA member state.
The Nature Conservancy is looking for a SNAPP Quantitative Research Fellow, Nature Assessments for Futures Thinking based in Virginia.
Just for Fun

New research suggests Earth is accompanied by at least six minimoons at any given time. These are small, natural satellites temporarily captured in orbit. Most are likely fragments knocked off the Moon by asteroid impacts, staying in Earth’s orbit for months or years before drifting back into solar orbit.
That’s it for this week.
I’m always keen to hear from you, so please let me know if you have:
new geospatial datasets
newly published papers
geospatial job opportunities
and I’ll do my best to showcase them here.
Yohan
98% accuracy is quite good… I wonder if transfer learning would work as well; say train on global data, including some held-out local data, and then fine tune on the local dataset