

🌐 Where should the next cell towers really go?
PLUS: improving air quality forecasting, new migration data from Facebook, and more.

Hey guys, here’s this week’s edition of the Spatial Edge — a newsletter that’s almost as optimised as a Zarr. With jokes that terrible, the aim is to make you a better geospatial data scientist in less than five minutes a week.
In today’s newsletter:
Cell Towers: Machine learning optimises tower placement.
Air Quality: Kalman-BiGRU improves forecast reliability.
SAR Ships: Classification-aware super-resolution boosts accuracy.
GeoFlow: AI agents streamline geospatial workflows.
Facebook: new geospatial migration dataset released.
Research you should know about
1. A smarter way to expand mobile networks
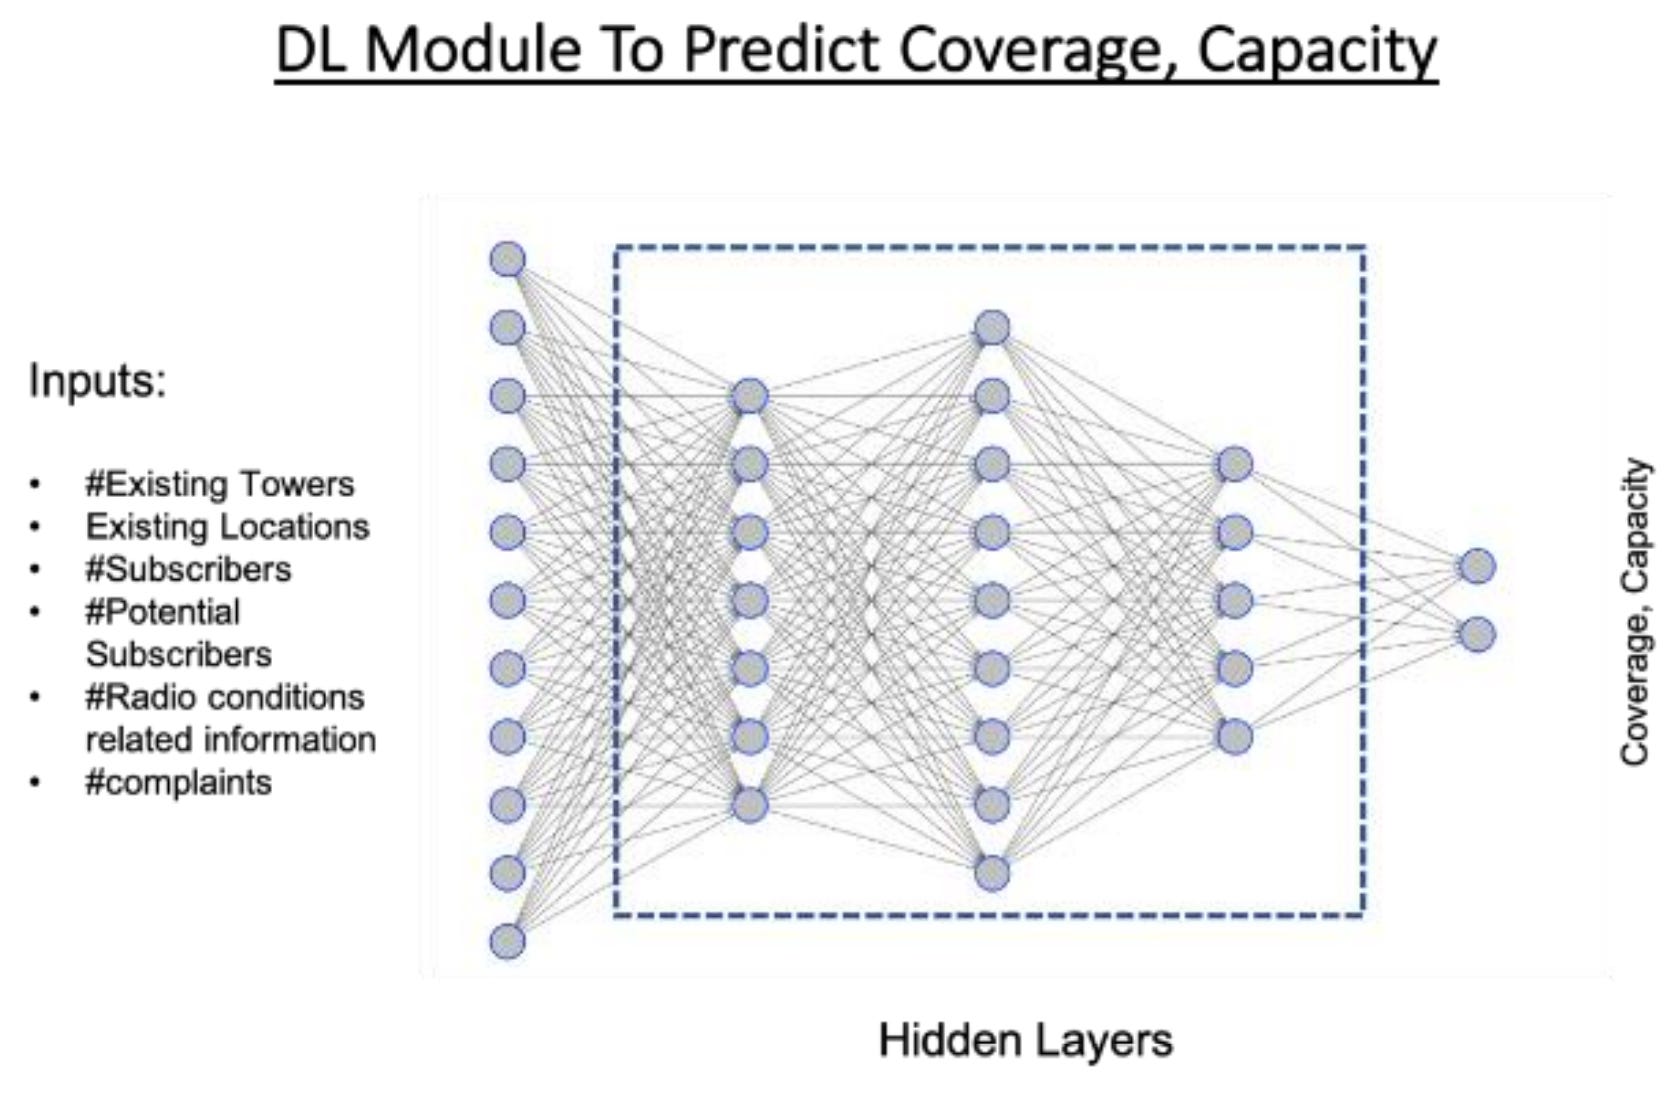
Ok, so I’m pretty interested in the impact of internet access and mobile connectivity on development (in fact, I’ve co-authored some work on the topic with Neil Lee and Zhiwu Wei). By extension, it’s important to try and work out where new cell towers should be constructed. Telecom operators have long relied on methods like drive tests, where engineers literally drive around with signal meters to measure network quality, and manual surveys to decide where to expand coverage. These approaches are slow, expensive, and often miss important realities like terrain, user density, or budget. A new study from Ericsson researchers outlines a machine learning framework that combines predictive modelling with spatial analytics to suggest where new towers should be built.
They use a deep neural network trained on features such as distance to existing towers, terrain, elevation, population density, and antenna characteristics. To do this, it draws on several datasets: drive test logs and crowdsourced signal measurements, network performance counters (automatic logs of call quality and dropped connections), geospatial data from sources like Google Maps for buildings, terrain and water bodies, and demographic statistics on population and subscribers. The model uses these inputs to predict signal coverage across a grid, producing a map of weak spots. Low-coverage areas are then grouped using clustering algorithms such as DBSCAN or K-means, with cluster centres suggested as candidate tower sites.
After candidate towers are identified, a cost-aware module ranks them by how much coverage improvement they deliver for the money. The process runs iteratively: each proposed tower is “added” virtually, coverage is recalculated, and the model updates its recommendations until targets are met or the budget runs out. The result is a scalable tool for adaptive network expansion.
2. Forecasting air quality more reliably

Air pollution forecasts are often undermined by missing data, noisy measurements, and unstable predictions. This paper introduces a Kalman-integrated Bi-GRU model that dynamically adjusts to uncertainty in environmental data while using a Chi-square divergence loss function to align predicted pollutant distributions with observed ones. Missing values are handled through ARIMA imputation, ensuring that temporal patterns are preserved.
Tested on U.S. EPA data from Denver (2022–2024) across six major pollutants, the model consistently outperformed LSTM and CNN-LSTM baselines. It achieved a coefficient of determination of 0.97 and cut error rates by over 12%, making it more accurate and stable than existing approaches. The architecture proved robust even with incomplete or noisy data, a common challenge in environmental monitoring.
The work highlights how adaptive attention and distribution-sensitive learning can strengthen AQI forecasting. Beyond research, this approach could support real-time environmental monitoring, policy planning, and public health alerts, especially in cities struggling with variable pollution conditions.
You can access the code and implementation here.
3. How to improve SAR ship classification without new data
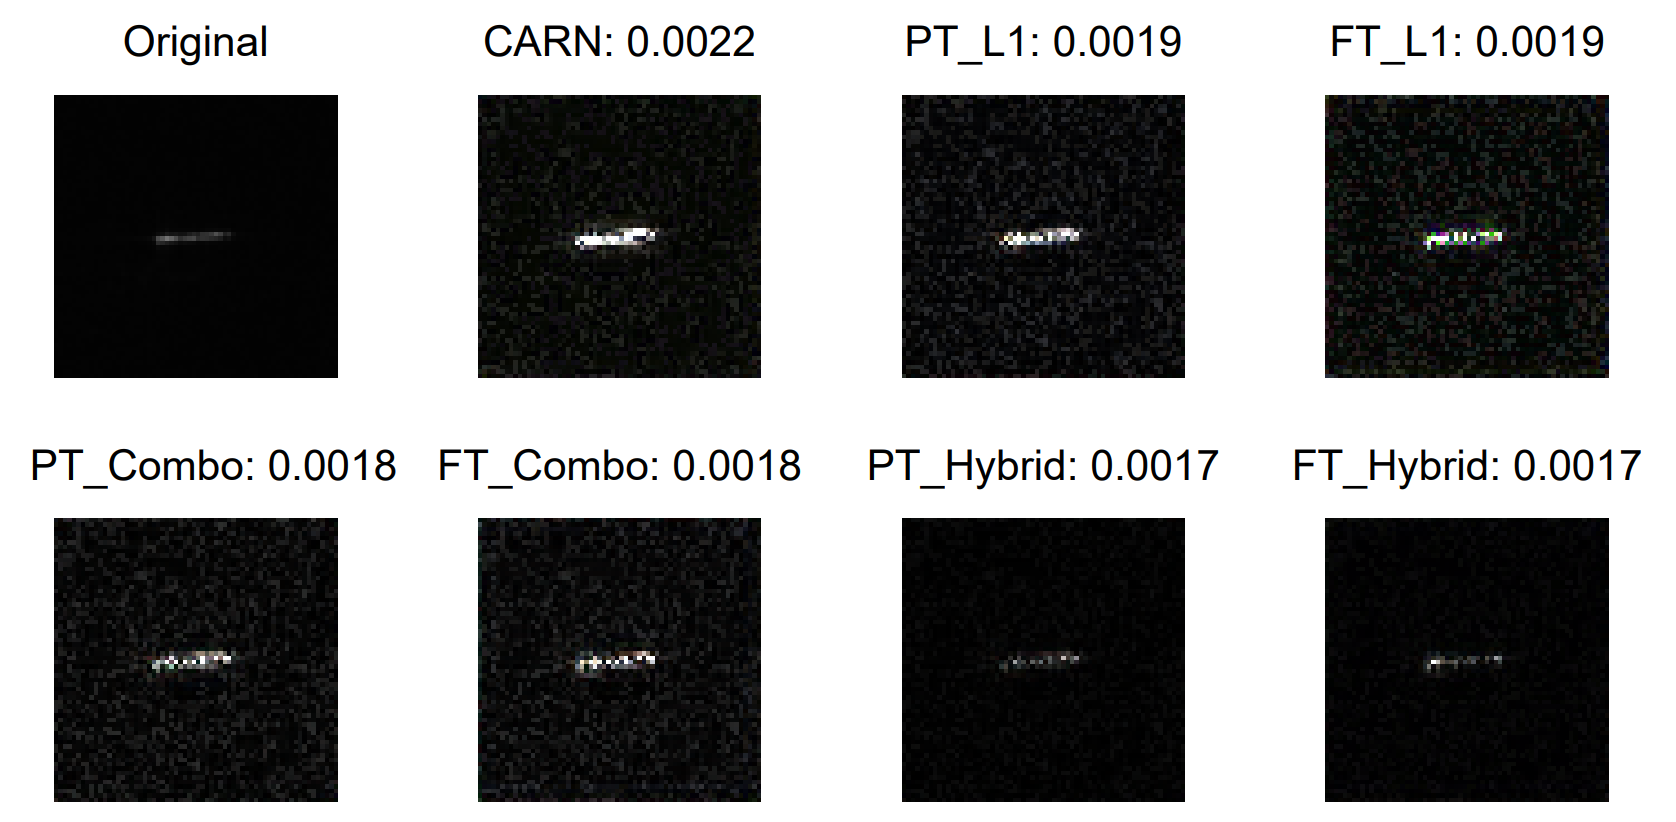
Ship monitoring in SAR imagery often suffers from low resolution, which limits how well vessels can be classified. Standard super-resolution techniques improve image sharpness but focus mainly on pixel-level quality metrics like PSNR and SSIM, which don’t always translate into better accuracy. This paper tackles that gap by making super-resolution “classification-aware,” integrating classification loss directly into the training process so that image enhancement is guided by the end task.
The team tested three super-resolution models (EDSR, CARN, RCAN) alongside five popular classifiers (ResNet, VGG, MobileNet, DenseNet) on the OpenSARShip dataset. They designed new loss functions that combine image quality and classification objectives, then fine-tuned the models so the super-resolved outputs not only look better but also preserve class-specific features. The results were clear: models like RCAN paired with a “Combo Loss” delivered higher F1-scores, outperforming state-of-the-art baselines for six ship categories.
Interestingly, they found that the best image quality scores didn’t always equal the best classification results. Some models sacrificed pixel-level metrics but did better at retaining ship contours and textures, which mattered more for recognition. Overall, the framework shows that task-aware super-resolution can make SAR ship classification more accurate without changing the classifiers themselves.
4. Automating geospatial workflows with GeoFlow
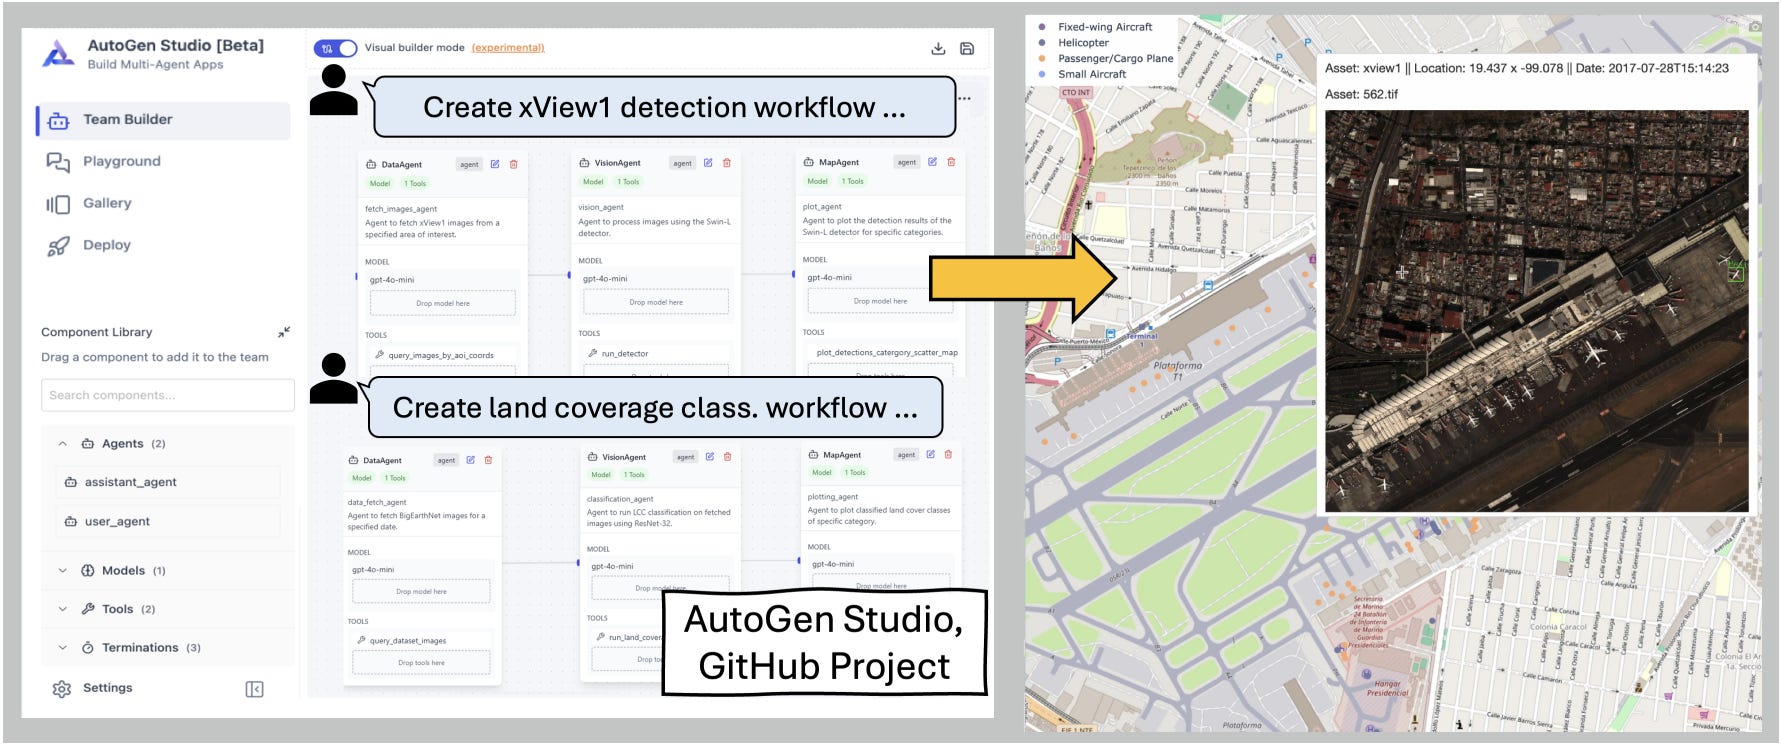
Building geospatial pipelines with AI agents is powerful but often messy: existing systems like Flow leave API calls vague, leading to errors when handling complex Earth observation tasks. GeoFlow tackles this by embedding explicit function-calling objectives into workflow graphs, so each agent knows exactly which GIS API to use and how.
Tested on the GeoLLM-Engine benchmark, GeoFlow raised task success by 6.8% and correctness by 3.3% compared to Flow, while using up to 4× fewer tokens than orchestration-heavy methods like AutoGen. It performed well across model families (OpenAI, Mistral, Qwen, Llama) and showed strong results even with open-source LLMs.
The authors also highlight GeoFlow’s potential as a no-code workflow design tool: analysts could generate workflows automatically, tweak them in a visual interface, and then run them directly on GIS platforms.
You can access the code and implementation here.
Geospatial Datasets
1. International migration flows dataset
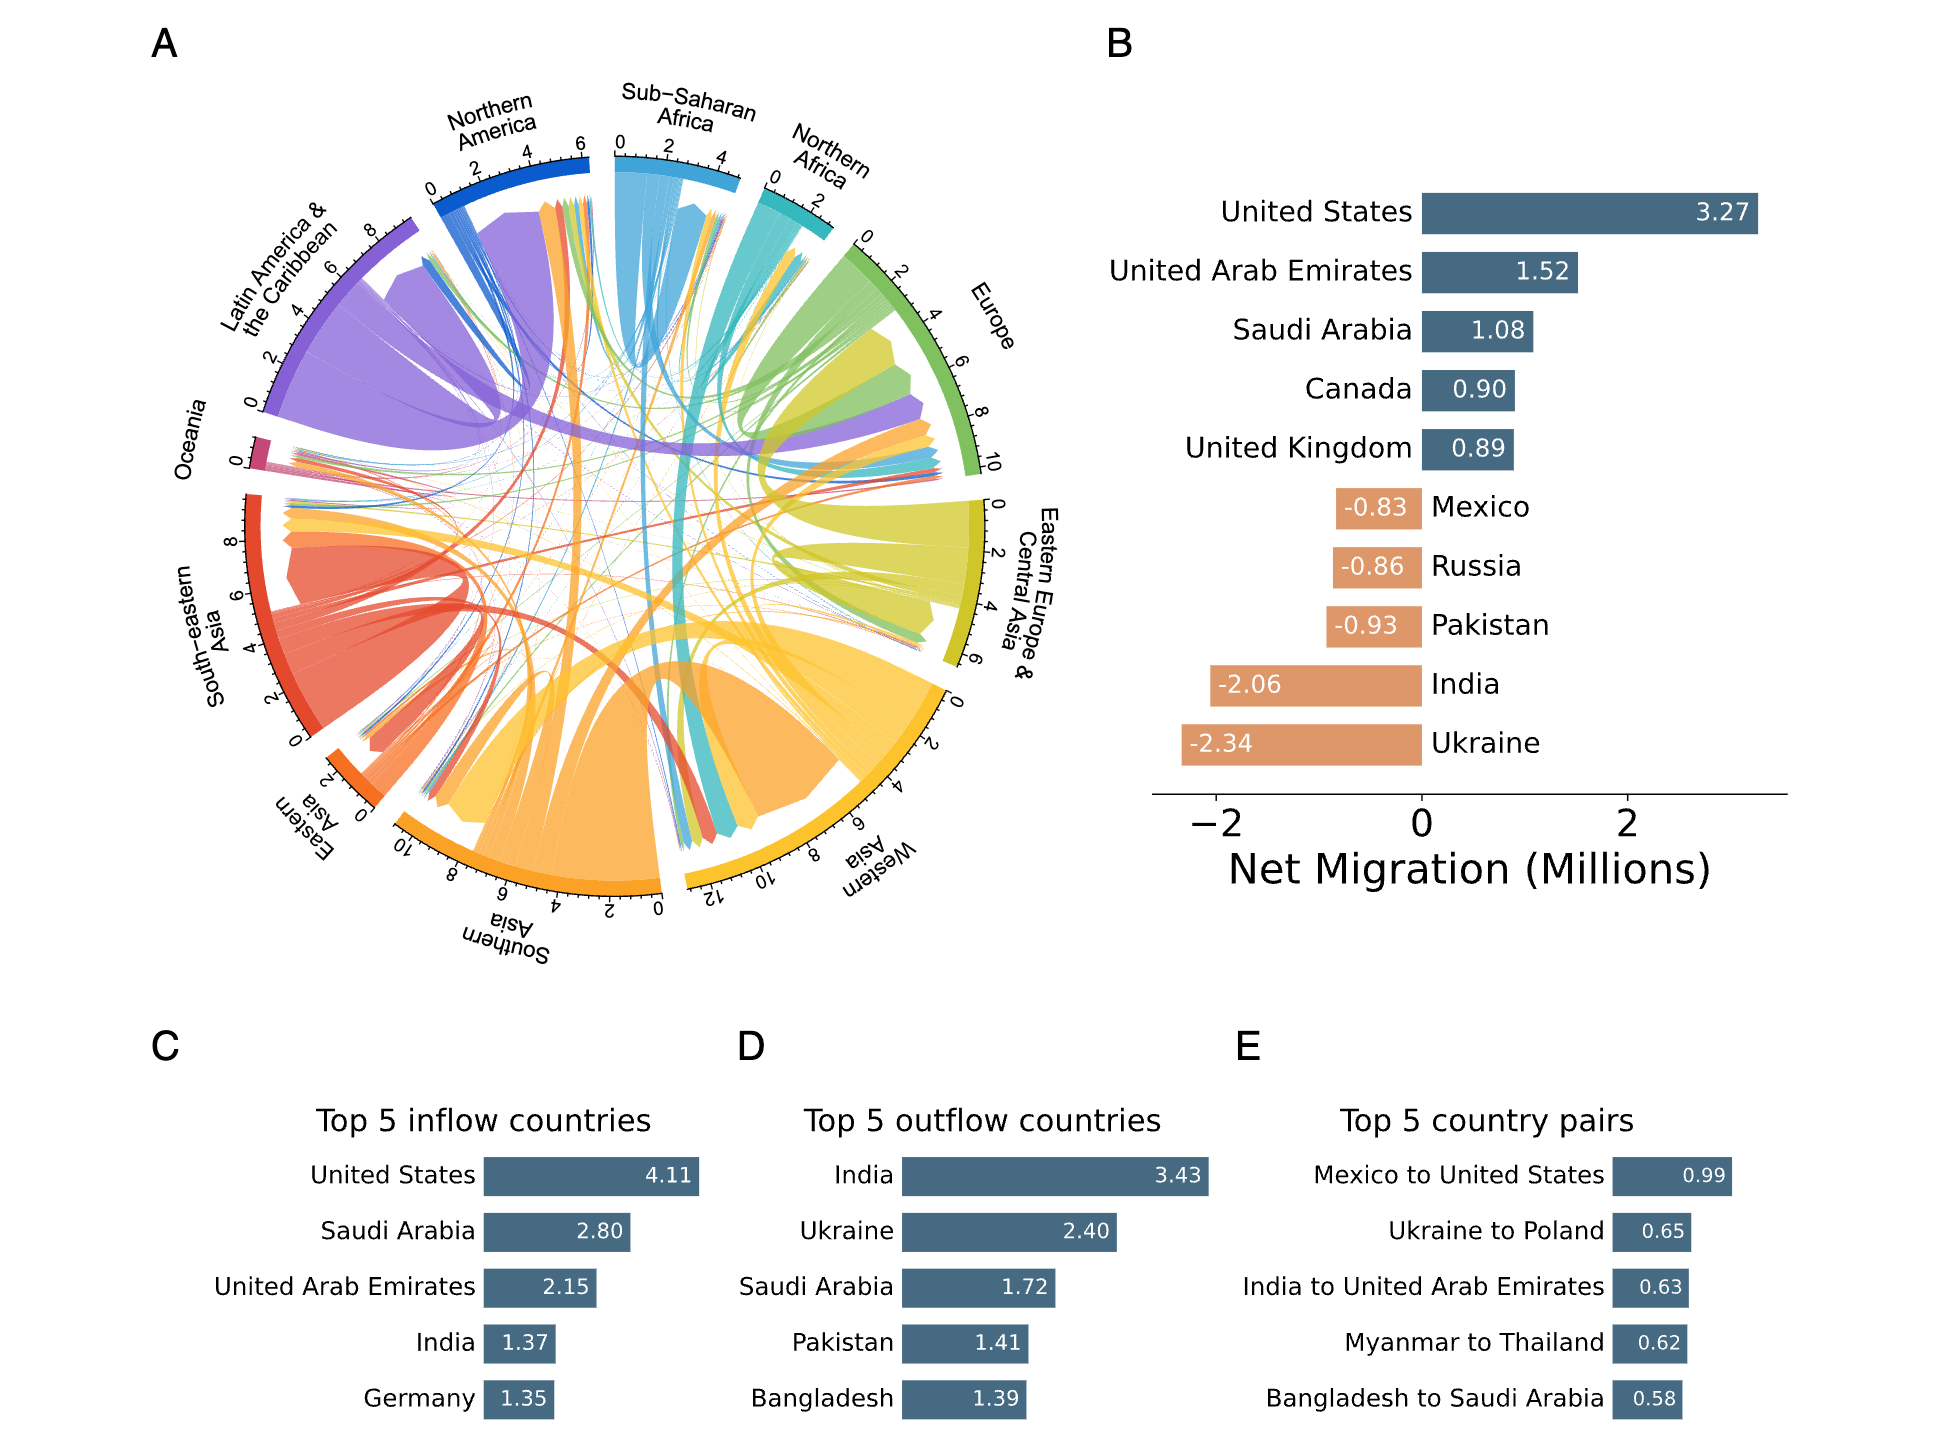
Meta provides monthly estimates of country-to-country migration between 181 countries from 2019–2022, based on privacy-protected data from three billion Facebook users. The dataset aligns well with official statistics where available. You can access the data here.
2. Drought severity index dataset

PDSI_CMIP6 is a new global dataset providing monthly self-calibrated Palmer Drought Severity Index values from 1850–2094, derived directly from 11 CMIP6 climate models. Unlike traditional offline PDSI products, it uses climate model hydrological outputs to ensure consistency with CMIP6 projections, and includes four future emission scenarios (SSP1-2.6 to SSP5-8.5). You can access the data here and the code here.
3. SAM2 UNeXT framework
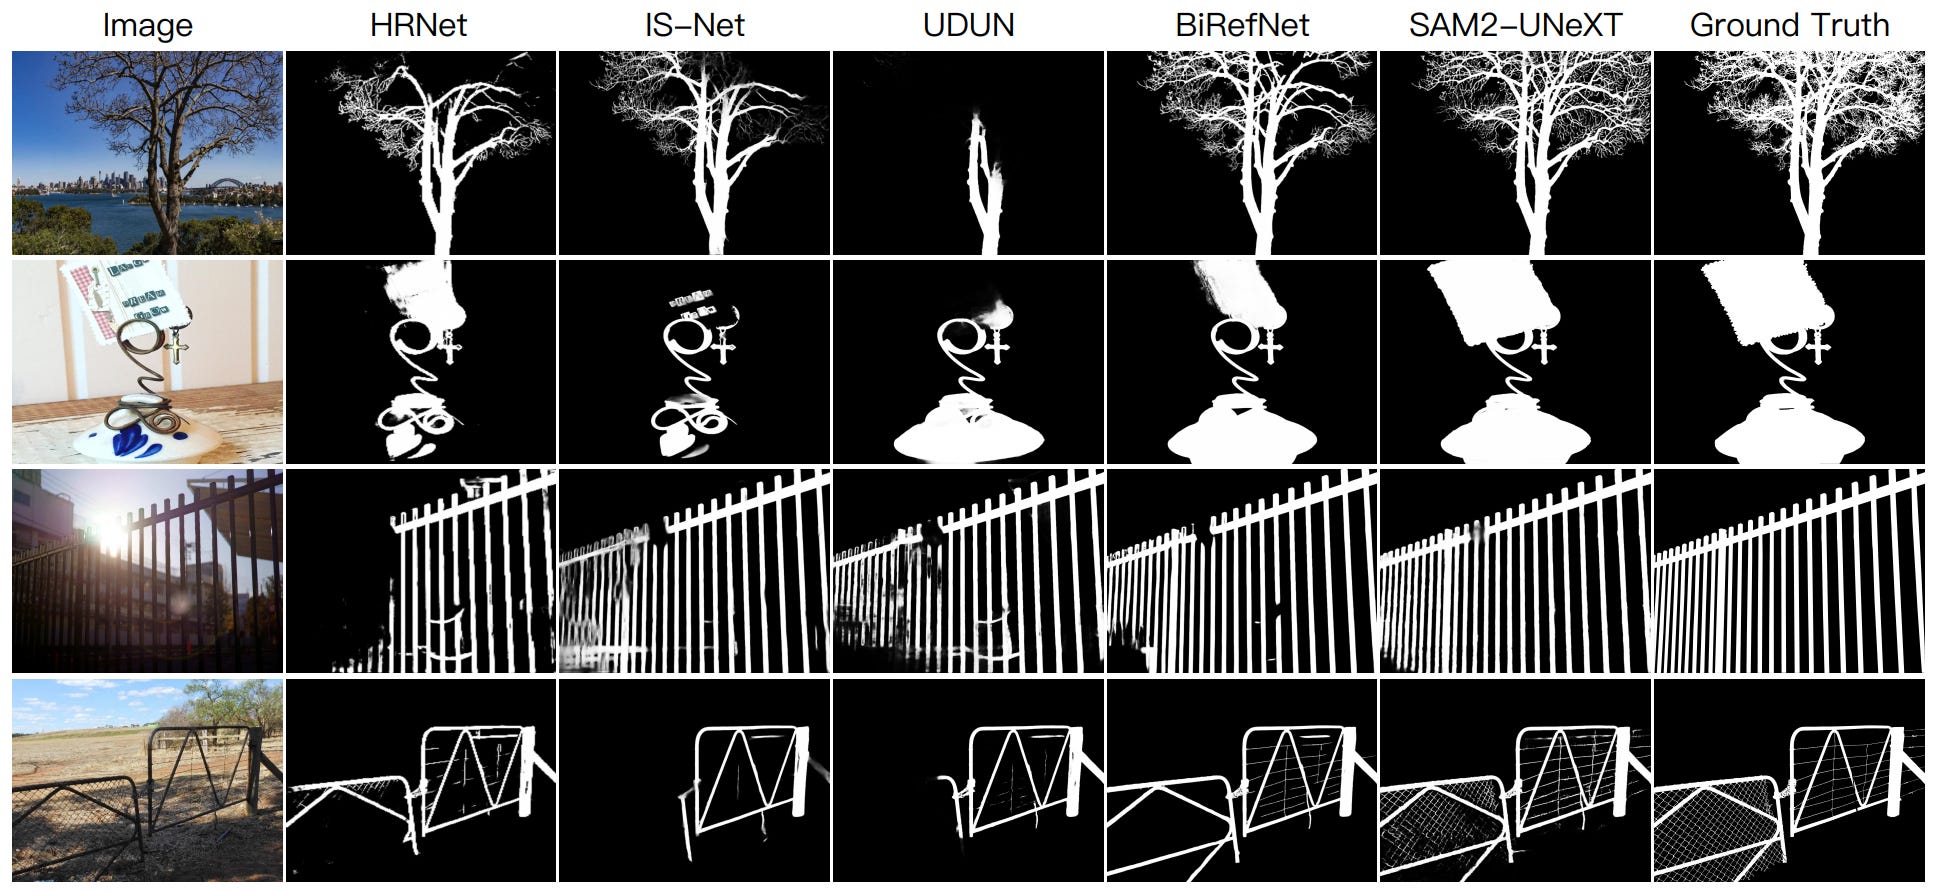
SAM2-UNeXT is a new framework that improves the Segment Anything Model 2 (SAM2) by pairing it with a frozen DINOv2 encoder for global semantics, plus a dual-resolution design and a simple U-Net decoder. This setup captures fine local details from SAM2 while fusing them with broader context from DINOv2 via a dense glue layer. You can access the code here.
4. High-res peatlands dataset

PEATGRIDS is the first globally consistent, high-resolution (1 km) dataset estimating peat thickness, bulk density, carbon content, and carbon stocks using digital soil mapping. It’s built from over 27,000 peat core observations worldwide. You can access the data here.
Other useful bits

Major TOM has released a prototype dataset that connects its data with Google DeepMind’s AlphaEarth embeddings, covering 62,489 grid cells of ~100 sq km each (about 6 TB in size). Unlike Sentinel-based samples, these embeddings capture aggregated annual information, adding a valuable temporal layer to physical sensor data.
city2graph is a new open-source Python package that converts geospatial data into graph structures. With support for PyTorch Geometric, it opens the door to advanced research in urban form, accessibility, transport networks, and graph-based spatial modelling.
Satellite images reveal the devastation of flash floods and rare cloudbursts in northern Pakistan, where more than 360 people have been killed. In Buner district alone, over 200 lives were lost in two days as swollen rivers and landslides destroyed entire villages, underscoring the growing intensity of monsoon disasters linked to climate change.
Amazon Bedrock is being integrated with GIS to enhance geospatial workflows using large language models, retrieval-augmented generation, and agentic workflows. The approach enables natural language queries, real-time data retrieval, and automated analysis.
Jobs
ESA is looking for an EO Systems Engineer based in Frascati, Italy.
The World Resources Institute is looking for a Geospatial Data Scientist in Jakarta, Indonesia.
The United Nations Logistics Base is looking for a Geospatial Information Officer based in Valencia, Spain
The World Meteorological Organization is looking for a Consultant under their Group on Earth Observations (GEO) Secretariat.
Just for Fun
A dense Saharan dust plume is sweeping north across the Mediterranean, reaching Crete and the Turkish coast. Satellite data show fine particles lifted from Libya and Egypt, carried by strong winds, with impacts on air quality, aviation, and regional weather.
That’s it for this week.
I’m always keen to hear from you, so please let me know if you have:
new geospatial datasets
newly published papers
geospatial job opportunities
and I’ll do my best to showcase them here.
Yohan