

🌐 Why archaeology might fix climate science
PLUS: resetting expectations for global reforestation, issues with satellite change detection models, and more.

Hey guys, here’s this week’s edition of the Spatial Edge — your weekly map to the geospatial world. The aim is to make you a better geospatial data scientist in less than five minutes a week.
In today’s newsletter:
Climate Models: Archaeology helps predict human climate responses.
Reforestation Reality: Global forest restoration potential drastically overestimated.
Change Detection: U-Net variations improve Earth observation change detection.
Street Views: Crowdsourced African road surface classification dataset available.
Research you should know about
1. Why archaeology might fix climate science

Climate scientists have long struggled with a pretty fundamental problem: they're great at modelling physical climate processes, but rubbish at predicting how humans will actually respond to climate change.
A new paper in Nature Communications suggests archaeology might hold the key. The authors argue that archaeological records provide a lot of important info on how past human societies responded to climate events, and they've developed a framework for integrating this cultural information into climate models.
The basic idea is clever.
Instead of treating culture as some mysterious black box, they use "species distribution models" to map where human populations lived under different climate conditions, then layer on "cumulative cultural evolution" theory.
The main idea is that climate change alters suitable habitats, which affects population density and connectivity between groups. The model then uses these spatial parameters to predict cultural dynamics. There are two elements to this:
Larger populations are expected to produce more innovation per unit time (since per capita innovation rate stays constant),
Greater connectivity increases transmission rates because people encounter each other more often.
Structured populations that are partially connected maintain both cultural diversity and large enough overall populations to sustain high innovation rates. When climate shifts fragment populations into isolated pockets, you get cultural divergence with periodic contact facilitating the spread of beneficial variants.
There are limitations, of course. The model can't predict specific cultural innovations or explain why identical climate events sometimes have completely different outcomes. But we now have a novel and systematic way to integrate the "human factor" into climate science.
2. Resetting expectations for global reforestation

If you've ever worked with global reforestation maps, you'll know there can be a lot of disagreement between them.
A new study in Nature Communications analysed 89 reforestation assessments and identified major flaws in several widely cited maps. This includes the Bastin map, which inspired the Trillion Trees initiative. These maps often use broad definitions of what qualifies as a forest, rely on outdated data, and overlook constraints such as fire-prone ecosystems and land-use conflicts.
The authors applied stricter criteria. They defined forests as areas with at least 60 percent tree cover, excluded fire-prone regions, and used updated high-resolution datasets. Based on this approach, they estimated a global reforestation potential of just 195 million hectares. This is between 71 and 92 percent smaller than earlier estimates.
Despite the smaller area, the potential climate benefit remains pretty massive. The study estimates that restoring these areas could deliver about 2,225 teragrams of CO₂ equivalent per year, which is roughly 5 percent of global emissions. However, applying some practical constraints quickly reduces this potential. Limiting reforestation to areas with secure land tenure brings the estimate down to 116 million hectares. Focusing only on protected areas reduces it further to 6.3 million hectares.
The study shows how difficult it is to align ecological, social, and climate goals. Around 60 to 70 percent of areas identified in earlier studies were excluded under this more conservative approach.
3. Turns out most satellite change detection models have major flaws
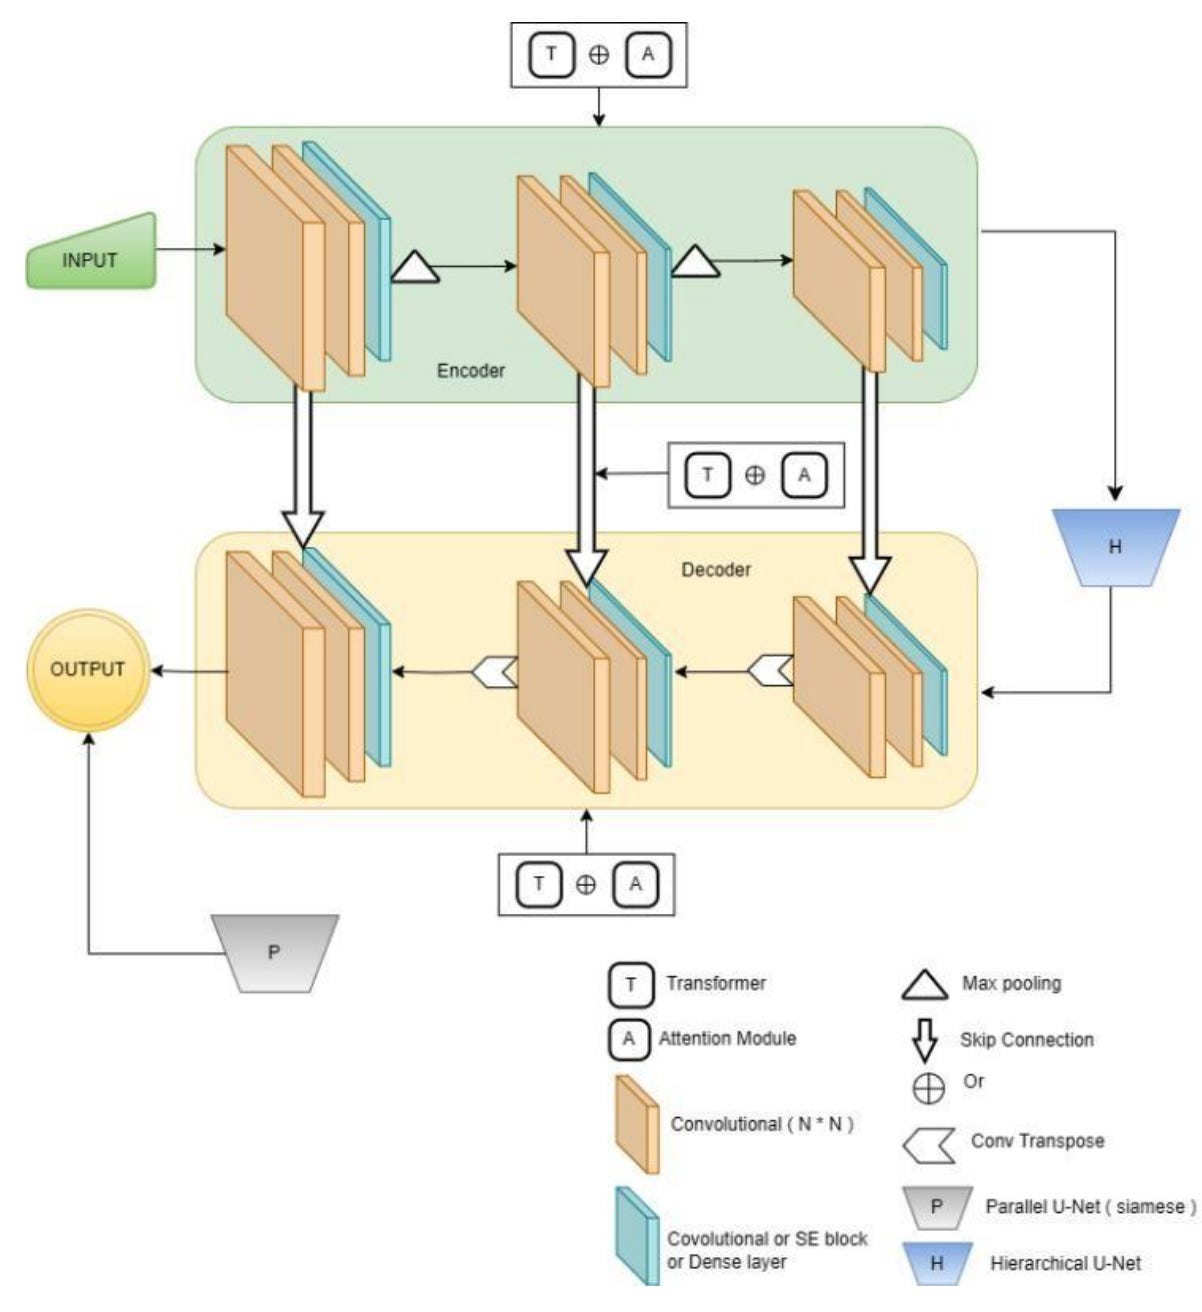
U-Net has become the go-to architecture for satellite image change detection, but its standard version has some pretty major limitations. A new comparative study from Gujarat Technological University analysed 18 different U-Net variations to see which ones work best for detecting changes in Earth observation data.
The researchers found that standard U-Net struggles with three key issues:
it can't capture long-range spatial relationships (pretty important when you're trying to spot changes across large areas),
it has trouble learning global context, and
its skip connections are a bit messy, connecting layers with very different semantic meanings.
These problems are particularly troublesome for satellite imagery where you need to understand how different parts of a landscape relate to each other over time.
The most promising variants tackle these issues head-on. Siamese Swin-U-Net replaces standard convolutional layers with transformer blocks that can capture long-range dependencies much better, achieving an impressive F1-score of 94.67% for land use change detection. NDR-U-Net takes a different approach by using nested dense residual blocks and achieved the highest segmentation accuracy with a Mean IoU of 0.92. Meanwhile, variants like Bilateral Attention U-Net and Optimised U-Net focus on fixing the skip connection problems by adding attention mechanisms or bottleneck structures that help information flow more smoothly through the network.
There's clearly no one-size-fits-all solution here. The study shows that the best U-Net variant depends heavily on your specific dataset and what you're trying to detect. For example, variants that work really well on high-resolution urban imagery might struggle with lower-resolution agricultural data. The trade-off between computational complexity and accuracy is also important. Some of the most accurate variants require significantly more processing power, which might not be practical for real-time monitoring applications. Still, this comparison is a useful roadmap for researchers trying to pick the right architecture for their satellite change detection projects.
Geospatial Datasets
1. Crowdsourced street view dataset

A new crowdsourced street view dataset of 200,000 images from Africa has been released to help classify road surface types: paved, unpaved, or unknown. These images, pulled from Mapillary and verified by expert labelling. You can access the data here and the code here.
2. Daily precipitation dataset

SC-PREC4SA is a new serially complete daily precipitation dataset for South America, covering 1960–2015. You can access the data here and the code here.
3. Agricultural remote sensing dataset
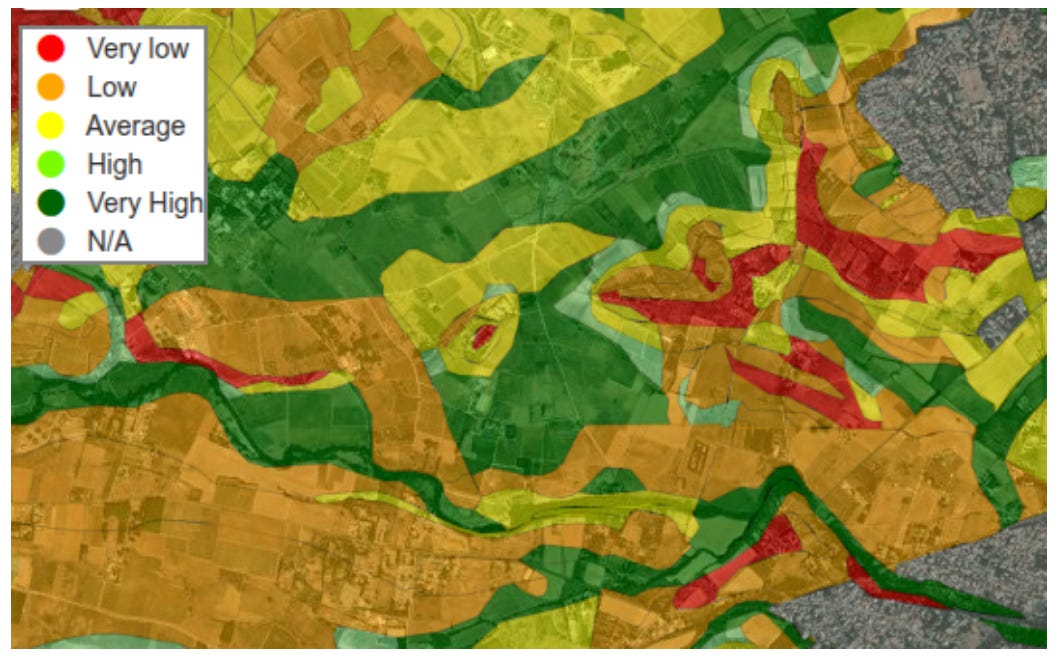
AgriPotential is a new open-access dataset combining Sentinel‑2 multi-spectral, multi-temporal imagery with expert-labelled agricultural potential maps for Southern France. You can access the data here and the code here.
4. Global natural forests dataset
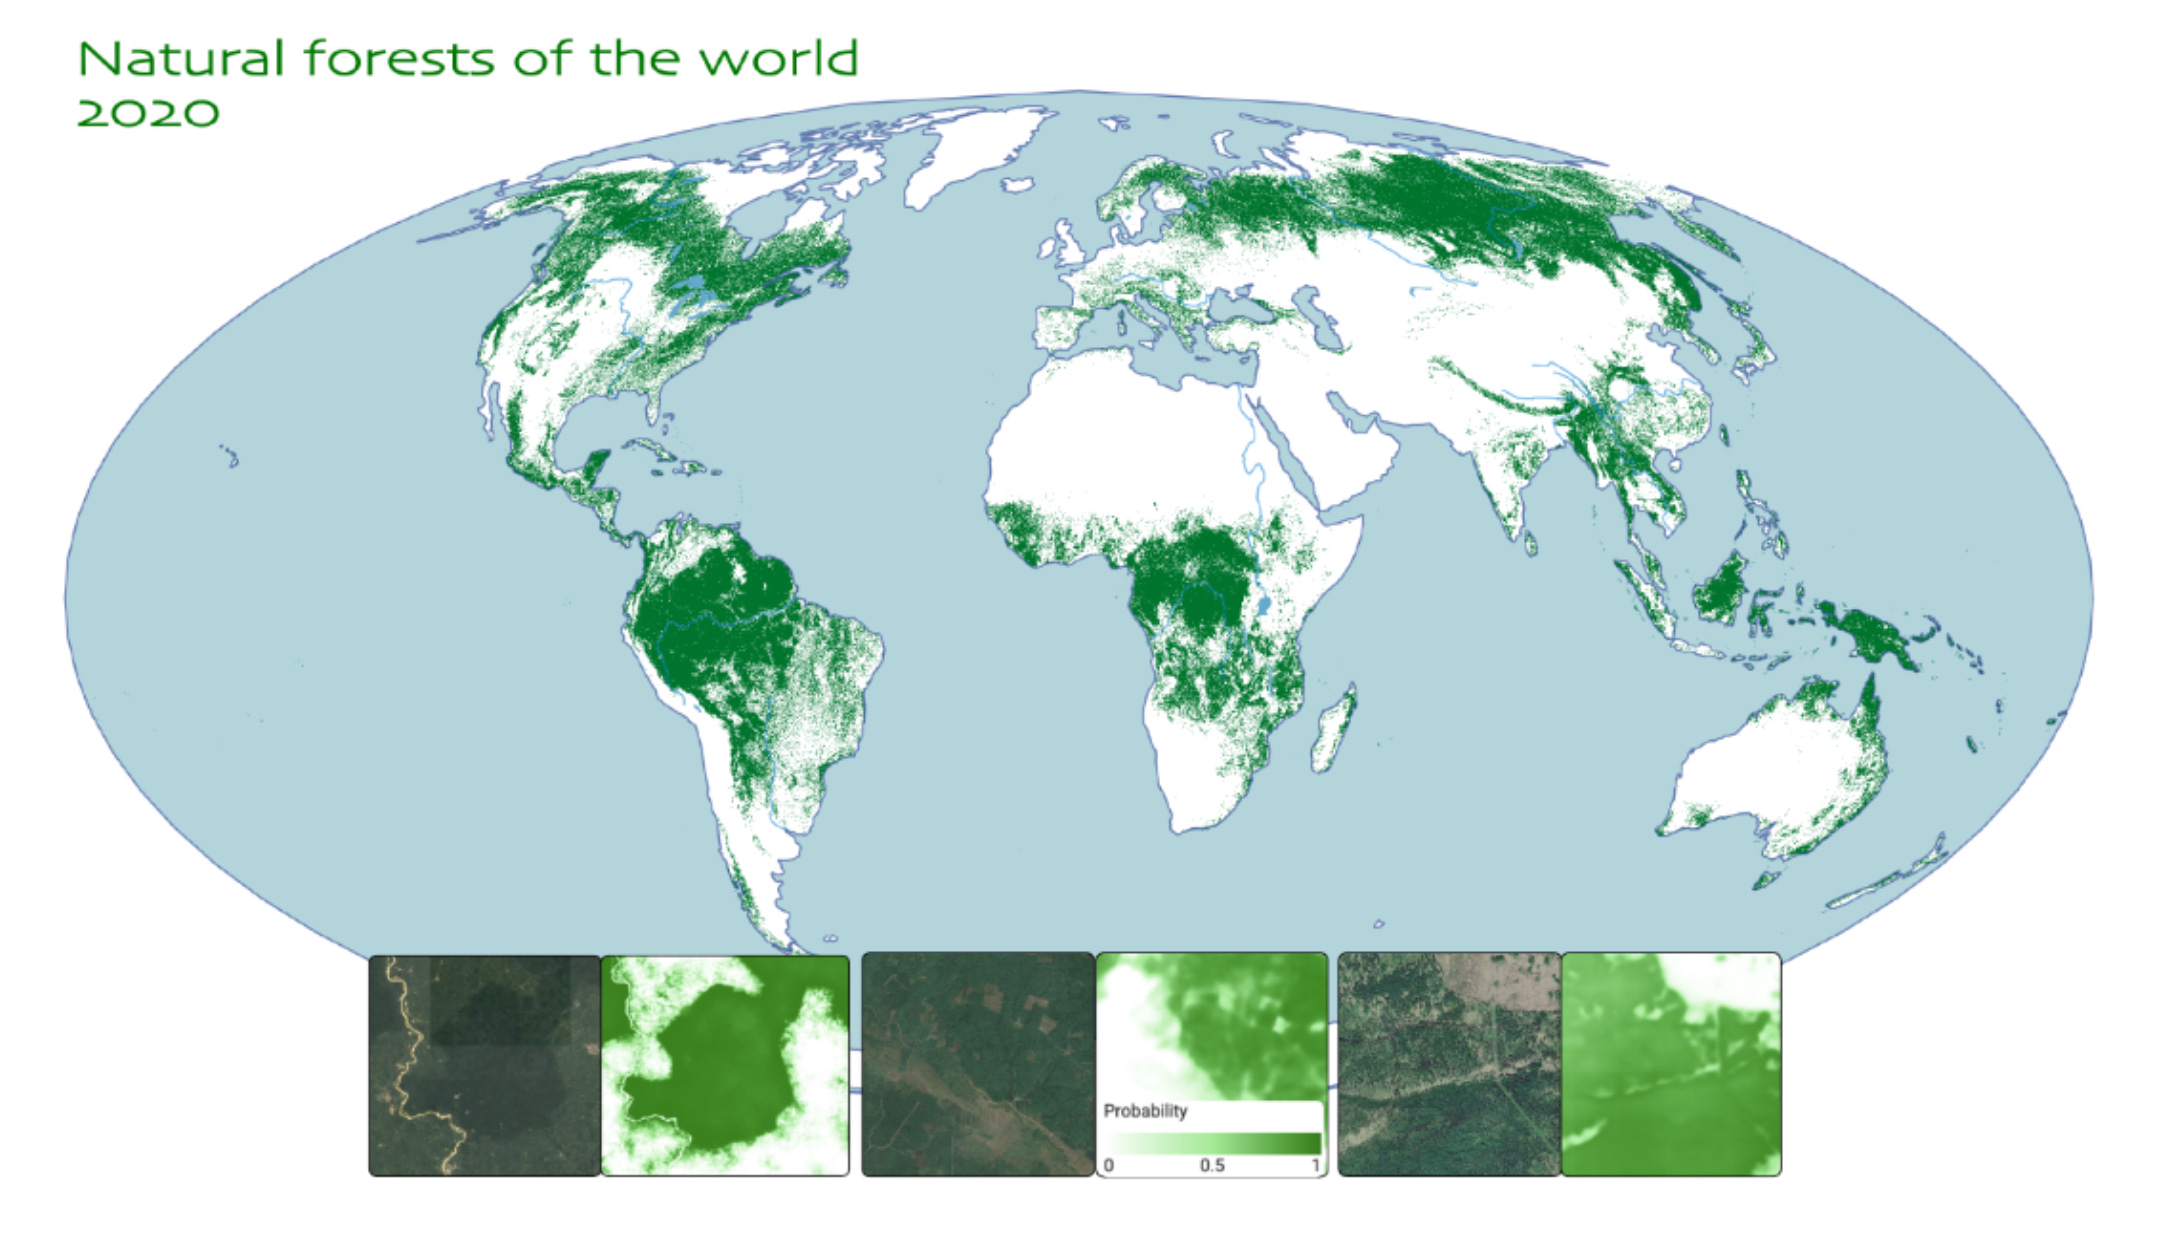
A new study from Google, WRI, and more introduces a high-res global map of natural forests for the year 2020. It provides 10m resolution pixel-level probabilities of natural forest presence, supporting forest monitoring, EUDR compliance, and biodiversity and climate goals. You can access the data here, the interactive map here, and the script here.
Other useful bits

Maxar just released the clearest-ever image of another satellite in space: a sharp 1.9 cm‑resolution shot of China’s Shi Jian 26 optical satellite.
Conflict zones are redrawing global air traffic maps, forcing airlines to reroute flights and absorb big fuel and time costs (just avoiding Iran can add two hours to some routes). As sky corridors shrink and risks grow from GPS jamming to volcanic ash, the challenges of flying in 2025 are increasingly shaped by geopolitics and nature.
NASA’s SPHEREx mission is mapping the entire sky in 102 infrared wavelengths and releasing data publicly every week. The mission aims to reveal the distribution of water, organics, and cosmic light across space and time. You can take a look at the data via NASA’s Infrared Science Archive, with full-sky maps coming after year one.
Jobs
The Nature Conservancy (TNC) is looking for a Quantitative Research Fellow based in Arlington, United States
Sylvera is looking for a Geospatial Data Scientist based in London, UK
UNOPS - United Nations Office for Project Services is looking for a GIS Senior Analyst based in Bangkok, Thailand
Humanitarian OpenStreetMap is looking for a remote Lead Software Engineer
IMPACT Initiatives is looking for a GIS & Remote Sensing Specialist based in Geneva, Switzerland
Just for Fun
![A family portrait of galaxies from the CRISTAL survey. Red shows cold gas traced by ALMA’s [CII] observations. Blue and green represent starlight captured by the Hubble and James Webb Space Telescopes](https://substackcdn.com/image/fetch/$s_!k_P3!,f_auto,q_auto:good,fl_progressive:steep/https%3A%2F%2Fsubstack-post-media.s3.amazonaws.com%2Fpublic%2Fimages%2F4ce8399c-198b-48d2-94c0-3c8c4f5602b1_1600x900.png "A family portrait of galaxies from the CRISTAL survey. Red shows cold gas traced by ALMA’s [CII] observations. Blue and green represent starlight captured by the Hubble and James Webb Space Telescopes")
Astronomers have used ALMA and the CRISTAL survey to peek into the early universe, just 1 billion years after the Big Bang. By mapping cold gas, they spotted star-forming clumps, swirling galactic disks, and dusty regions hidden from other telescopes.
That’s it for this week.
I’m always keen to hear from you, so please let me know if you have:
new geospatial datasets
newly published papers
geospatial job opportunities
and I’ll do my best to showcase them here.
Yohan