

🌐 Why we’re miscalculating urban poverty
PLUS: Improving flood maps with heavy-duty AI, predicting wildfires and more

Hey guys, here’s this week’s edition of the Spatial Edge — a weekly round-up of geospatial news. We’re a bit like Tensorflow. Some people still think we’re kinda cool, but nobody else is interested. In any case, the aim is to make you a better geospatial data scientist in less than 5 minutes a week.
In today’s newsletter:
Urban Road Access: New metrics map road deprivation in Africa.
AI Flood Mapping: Fine-tuned models improve disaster detection accuracy.
Wildfire Forecasting: Global graph networks predict fires months ahead.
Soil Health Sensing: Satellite data estimates carbon and nitrogen levels.
Renewable Energy Data: Hourly climate projections for future power planning.
Research you should know about
1. It’s not the distance to the road. It’s the dirt.
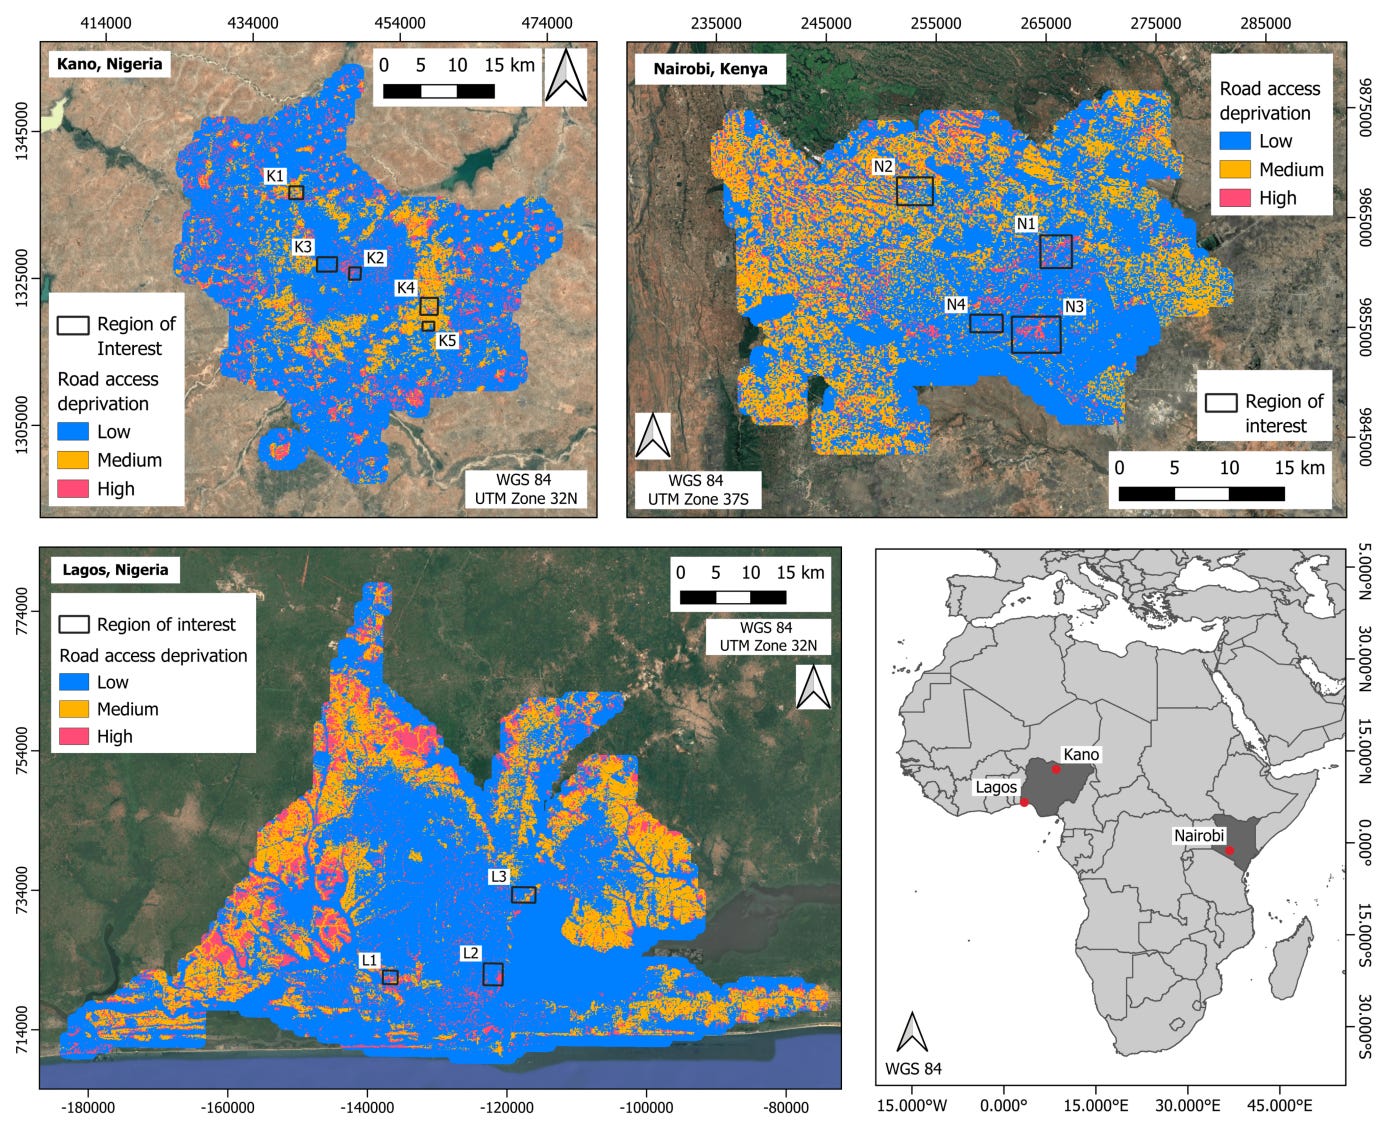
Access to motorable roads is a massive issue in rapidly urbanising regions like Sub-Saharan Africa, where informal settlements often get left off the map. A new study tries to address this by proposing a new way of modelling ‘road access deprivation’ in Nairobi, Lagos and Kano. Instead of just measuring distance, they combined two clever metrics. First, they developed a distance-agnostic accessibility measure that counts how many buildings obstruct the path between a structure and the nearest road. Second, they integrated data on road surface type to distinguish between paved and unpaved infrastructure. This allowed them to classify areas into low, medium and high deprivation levels based on whether residents have direct access to a paved road, a dirt track or are physically cut off from the network.
When they ran this model across the three cities using open geospatial data, the results showed that highly deprived areas are actually less common than you might expect. The majority of built-up zones fell into the low or medium deprivation categories, meaning most buildings do have direct access to some form of motorable road. However, the extent of severe disconnection varies quite a bit between locations. For instance, high deprivation areas made up only 11.8 per cent of Nairobi but climbed to 27.7 per cent in Kano. This suggests that while total physical isolation is a specific problem, a large chunk of the urban population is dealing with the ‘medium’ deprivation of having direct access but only to poor-quality, unpaved surfaces.
To see if these maps reflected reality, the team validated their model against data crowdsourced from local communities. The system proved highly effective at identifying well-connected, low-deprivation areas, achieving strong accuracy scores in Nairobi and Lagos. It struggled a bit more with the ‘medium’ category, often confusing it with low deprivation. This usually happened because the underlying data might misclassify a road’s surface type or because community members perceive access differently than the rigid definitions of the model. Despite these hiccups, the study shows that combining building obstruction metrics with road quality data is a promising, scalable way to identify disconnected neighbourhoods and help city planners prioritise upgrades in data-scarce environments.
2. Improving flood maps with heavy-duty AI
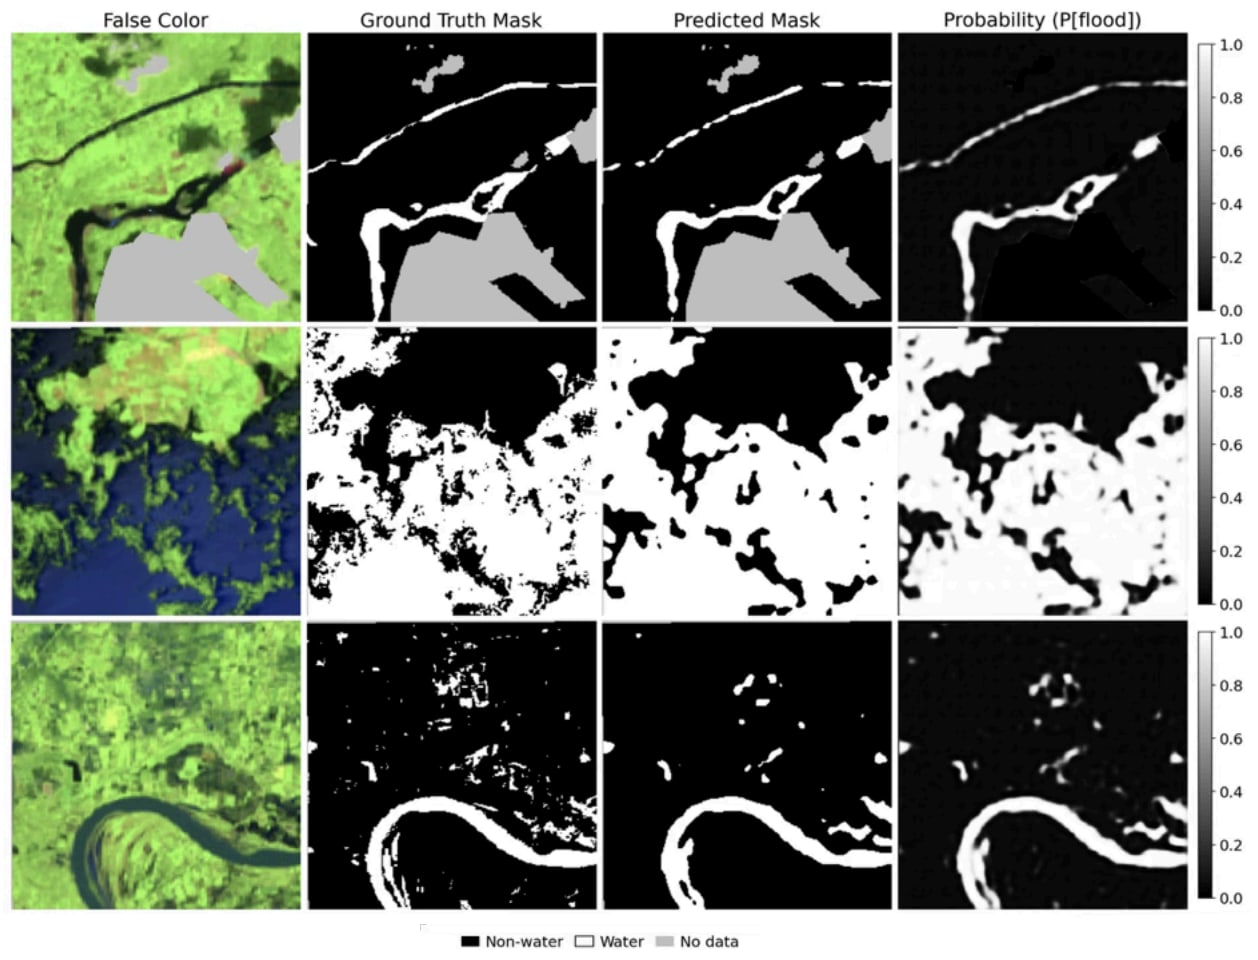
Flooding is causing havoc worldwide, with 2024 seeing devastating events from Valencia to Vietnam. While we have massive archives of Earth observation data, using it effectively is tough because standard AI models need huge amounts of labelled data. To tackle this, researchers took an existing Geospatial Foundation Model (GFM) called TerraMind and fine-tuned it specifically for flood detection. They used a new dataset called FloodsNet, which combines both Sentinel-1 radar and Sentinel-2 optical imagery for 85 global flood events. The goal was to see if retraining this pre-existing ‘brain’ with a rich, multimodal dataset could handle the messiness of flood data better than current methods.
The study ran experiments on four different versions of the model, tweaking the size and whether the core ‘backbone’ was frozen or allowed to update. They found that the ‘base unfrozen’ configuration offered the best balance, delivering strong accuracy without the heavy computational price tag of the larger models. While the massive 326-million-parameter version achieved the best recall among the GFM options, it didn’t offer enough of an overall performance boost to justify the extra cost. It seems that for practical flood mapping, a mid-sized model that can adapt its internal weights is the most efficient choice.
Things got interesting when they compared these GFMs against a standard U-Net, a conventional deep learning model that has been around for years. Surprisingly, the U-Net achieved better recall than every single TerraMind configuration, meaning it missed fewer flooded pixels overall. While the Foundation Models produced smoother and more coherent maps, the U-Net was often sharper at picking up fine details. This suggests that while multimodal GFMs are promising for unlocking vast data archives, traditional supervised models are still holding their ground when it comes to catching every last bit of water during a disaster.
3. Predicting wildfires with Earth-as-a-graph

Climate change is turning wildfire forecasting into a global priority. Traditional models often struggle to capture the complex, non-linear interactions between weather, vegetation, and human activity that drive fires over long periods. To address this, a team of researchers has developed FireCastNet, a new deep learning model that treats the Earth system as a giant interconnected graph. By combining 3D convolutional encoding with a Graph Neural Network (GNN) based on the GraphCast weather model, FireCastNet learns from both local fire dynamics and distant climate ‘teleconnections’, like how ocean temperatures in the Pacific might influence fire risk in Africa months later.
Trained on the comprehensive SeasFire datacube, which includes climate, vegetation, and human variables from 2001 to 2021, the model predicts burned area patterns up to six months in advance. When benchmarked against other state-of-the-art AI models, FireCastNet came out on top, particularly in fire-prone regions like Africa, South America, and Southeast Asia. The study found that giving the model longer time-series data significantly boosted its ability to make robust long-term predictions, confirming that fires are often the result of slowly accumulating conditions like drought and fuel buildup.
Interestingly, while a single global model performed well, the researchers also tested a ‘Local Area Modeling’ approach. This involved training specific models for different biomes, refining the graph’s mesh to be ultra-high resolution over a target region while keeping the rest of the globe coarser to capture those important long-range links. This local tuning improved accuracy in places like Europe and the Middle East but surprisingly didn’t help everywhere. In regions like Southeast Asia and Australia, the global model still reigned supreme, suggesting that for some parts of the world, those broad, planetary-scale connections are just as critical as local details.
4. Measuring soil from the sky
Precision agriculture relies heavily on accurate soil data, but traditional physical sampling is slow, expensive, and logistically difficult. A team from CO2 Angels and the European Space Agency has developed a scalable system to estimate soil properties like organic carbon and nitrogen directly from satellite data. They used a hybrid modelling approach that combines direct spectral observations with environmental drivers such as climate, terrain, and vegetation traits. By integrating physics-informed machine learning with foundation model embeddings, the system can infer underground soil health conditions even when the surface is covered by crops.
The researchers trained their model on a massive harmonised dataset of European croplands, incorporating data from Sentinel-2, Landsat, and MODIS. They applied a rigorous validation method known as spatial blocking, where test samples were separated from training data by blocks of approximately 100 kilometres. This strict separation ensures the model isn’t just memorising local geographic patterns but is genuinely learning to predict soil properties from environmental signals.
The performance varied significantly depending on the nutrient being analysed. The model proved highly effective for Soil Organic Carbon and Nitrogen, achieving a Concordance Correlation Coefficient of 0.77 for both, with a Mean Absolute Error of 5.12 g/kg for carbon and 0.44 g/kg for nitrogen. However, it found Phosphorus and Potassium much harder to pin down, with correlation coefficients dropping to 0.53 and 0.58 respectively. The system also successfully quantified its own uncertainty, achieving 90% coverage for its prediction intervals, which suggests it is a viable tool for carbon markets and broad-scale monitoring even if it isn’t quite ready for precise phosphorus management.
Geospatial Datasets
1. Climate projections and renewable energy generation dataset

This dataset addresses the critical need for high-resolution energy modelling by providing hourly climate projections and renewable energy generation data for mainland China. Spanning from 2021 to 2060, it uses analog-based temporal downscaling to refine daily Global Climate Model outputs into the hourly resolution required for accurate power system planning. You can access the data from the Zenodo projects cited (reference no. 41 to 60) and the code here.
2. Flood hazard mapping framework

This study presents a hybrid framework for flood hazard assessment in the Swat River Basin. It blends machine learning with coupled hydrologic–hydraulic modelling.
3. Soil Moisture Climatological Record

The SMCR provides the first global, satellite-derived soil moisture record that spans from 1980 to 2023 at a daily, 1 km resolution.
Access the dataset:
Access the code here.
4. Railway network dataset

The Italian Railway Network Dataset offers a comprehensive look at multi-type train operations across Italy, spanning from January to June 2024. It covers over 3,300 trains and nearly 1,400 stations. You can access the dataset here and the processing code here.
Other useful bits

By analysing how ice flows over the bedrock, researchers have produced the most detailed map yet of Antarctica’s hidden ‘underbelly’, revealing thousands of previously unknown hills and valleys. This is a crucial leap for climate science, as knowing the shape of this buried landscape is essential for predicting exactly how the ice sheet will react to a warming world.
Vantor has slashed satellite imagery delivery times from 90 minutes down to just 11. By processing data right at the edge rather than in central queues, their new approach ensures vital intelligence reaches the people who need it faster than ever before.
ESRI founder Jack Dangermond envisions a ‘planetary nervous system’ where digital twins act as living, evolving entities rather than static snapshots. He argues that the industry’s next great leap depends less on new software and more on a cultural shift towards sharing data to solve global challenges.
FAO’s Hand-in-Hand Initiative has released a new ‘suite’ of geospatial datasets aimed at transforming agriculture and rural development across more than 80 countries. By using advanced analytics to pinpoint high-impact investment opportunities, this project provides a vital roadmap for fighting global hunger through smarter, data-driven planning.
Jobs
The World Bank is looking for a Senior Technical Lead for Geospatial Solutions based in Bulgaria.
Genex Systems is looking for a GIS Analyst based in Mountain View.
ESA is looking for a Graduate Trainee in Earth Observation Foundation Modelling based in Frascati.
The Lincoln Institute of Land Policy is looking for a remote Geospatial Backend Software Developer based in the US.
ETH Swiss GeoLab is looking for an Office Manager based in Zurich (and eventually, Lucerne).
Just for Fun

That’s it for this week.
I’m always keen to hear from you, so please let me know if you have:
new geospatial datasets
newly published papers
geospatial job opportunities
and I’ll do my best to showcase them here.
Yohan