



Hey guys, here’s this week’s edition of the Spatial Edge, a place where every pixel’s life story fits into 128 numbers. Anyway, the aim as usual is to make you a better geospatial data scientist in less than five minutes a week.
In today’s newsletter:
Wildfire Risk: US building losses could nearly triple by 2060.
City Mass: Bigger cities need less built material per person.
Embedding Forecasts: Predicting land change in foundation model embedding space.
OlmoEarth v1.3: Ai2 releases global 10 m satellite embeddings.
Weather Data: DeepMind opens the datasets behind WeatherNext 3.
Research you should know about
1. Wildfire risk to US buildings could nearly triple by 2060
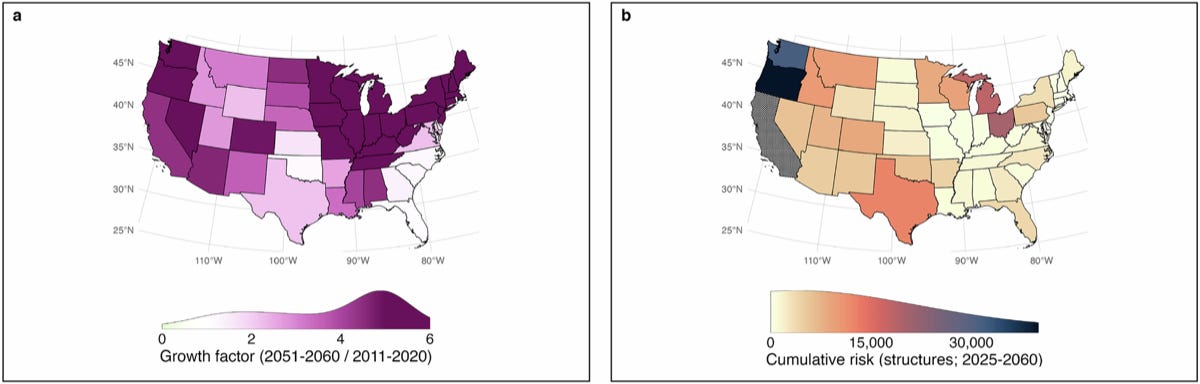
Wildfires are destroying more homes across the US, and it’s not just because fires are getting bigger: people keep building in fire-prone places. Most risk assessments treat buildings as a fixed snapshot, even though development keeps spreading into flammable landscapes. A new study in Nature Communications from the University of Colorado Boulder and partners models changing fire and changing settlement patterns together.
The team reconstructed fire risk to buildings from 1945 to 2023 and projected it to 2060 by combining burned area, settlement history and past building losses. (1) Hazard came from a Bayesian wildfire model driven by three climate models under RCP 4.5. (2) Exposure came from HISDAC-US, a gridded record of development built from more than 370 million Zillow property records, projected forward for each ecoregion. (3) Vulnerability came from a new Exposure-Adjusted Structural Loss Index, which measures the share of buildings damaged relative to the share of land burned between 2000 and 2023. They then overlaid the results with census-tract measures of socioeconomic hardship.
Without adaptation, building losses are projected to nearly triple, with 133,200 to 449,100 buildings damaged or destroyed by mid-century. Annual burned area roughly doubles nationally by 2051–2060 compared with 2011–2020, and more than triples in the West. California alone accounts for about 156,500 buildings lost between 2025 and 2060. The West stays the hotspot, where 30% of the highest-risk census tracts also face socioeconomic hardship, but risk is already spreading east. For context, 205,096 buildings were damaged or destroyed between 2000 and 2023. The code is on GitHub.
2. Why bigger cities need less concrete per person
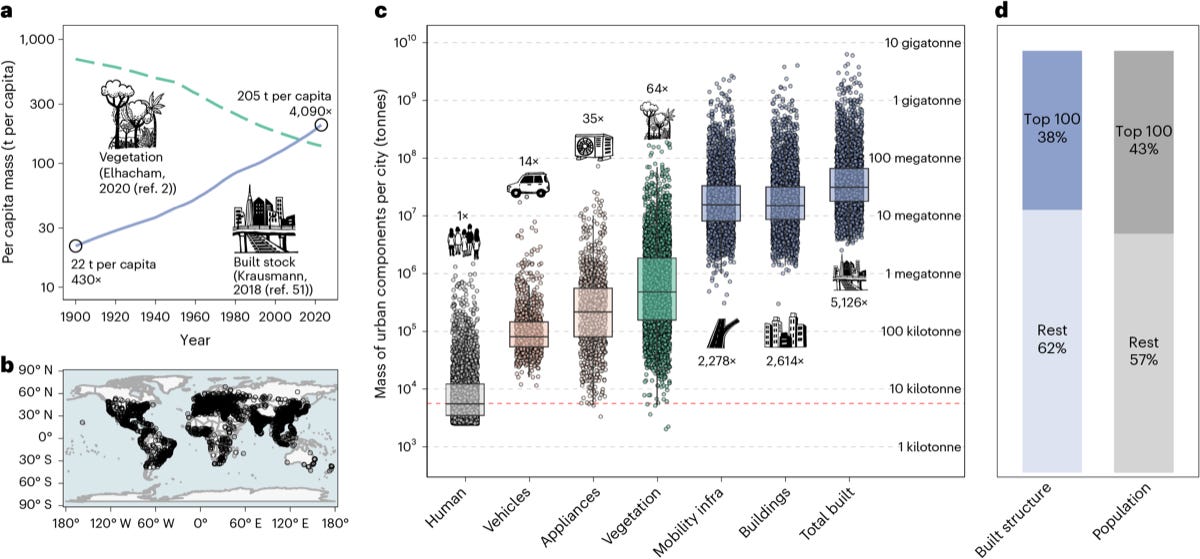
Planners usually assume each extra resident needs the same amount of buildings and roads, but it turns out cities don’t work that way. That per-person assumption sits behind forecasts that urban construction will use about 90 billion tonnes of material a year by 2050, up from 40 billion in 2010. A new study in Nature Cities from NYU Shanghai tests it across the globe.
The researchers estimated the mass of buildings, roads, pavements and subway networks in more than 3,000 cities, then measured how that mass scales with population. They combined high-resolution maps of buildings and transport infrastructure with region- and type-specific material intensities (how many tonnes of material go into each kind of structure). They looked at scaling across cities, and across neighbourhoods within each city.
Built mass grows more slowly than population, with a scaling exponent of 0.90 across cities and 0.75 across neighbourhoods, so bigger cities and denser neighbourhoods use less material per person. In total, the world’s cities hold about 327 gigatonnes of built mass, more than 5,000 times the body mass of the people living in them, and the 100 biggest cities account for 38% of it. The authors argue that height and building-size limits flatten natural density gradients and can push material use up. The data and code are on figshare, and there’s an interactive map too.
3. Forecasting land surface change in embedding space
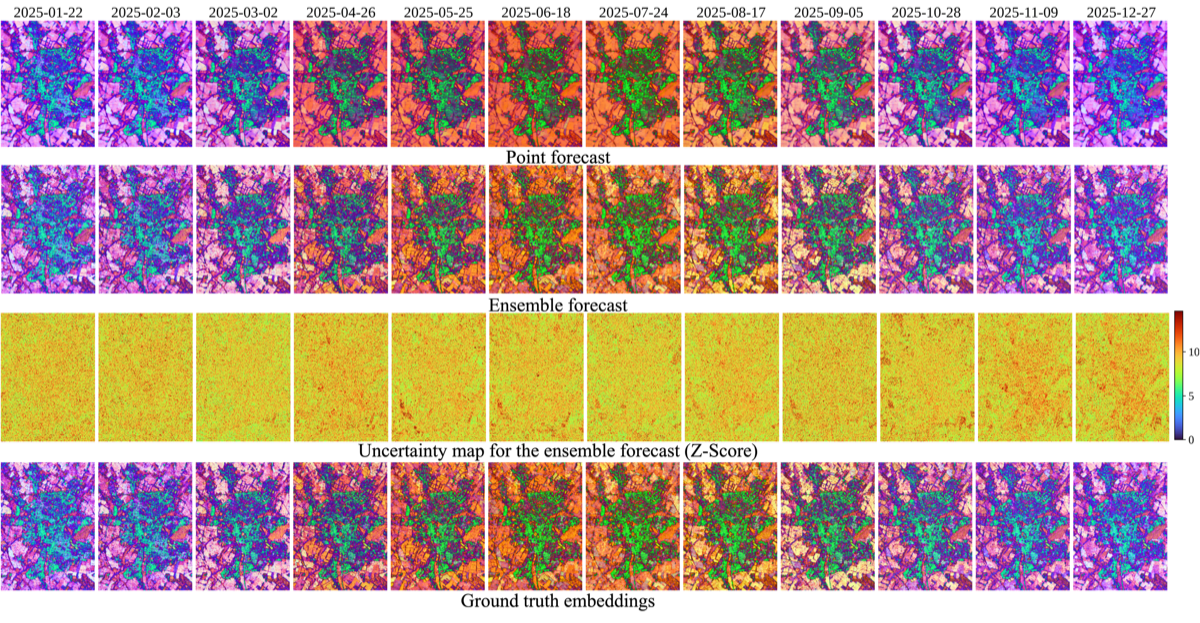
Forecasting how the land surface will change usually means predicting future satellite pixel values, and clouds, shadows and sensor noise make that pretty messy. Models end up spending a lot of their capacity on noise instead of real change, like crops growing or cities expanding. A new preprint from the University of Cambridge, Microsoft AI for Good, Aalto University and Wuhan University forecasts foundation model embeddings instead.
Their model, E²Forecast, is a transformer that takes a history of embeddings captured on irregular dates and predicts the embedding for any future date. Each observation becomes a token carrying its embedding and acquisition date, so the model copes with gaps and different sensors. It has two branches: (1) a Gaussian branch that gives a point forecast with uncertainty for each dimension, and (2) a rectified-flow branch that generates an ensemble of possible futures. They tested it on Sentinel-1 and Sentinel-2 time series across nine embedding spaces, including OlmoEarth, Prithvi-EO-2.0, AlphaEarth, TESSERA and SatCLIP.
Forecasting embeddings instead of spectral values halved the forecast error (cosine distance fell from 0.20 to 0.10) and made the model much less overconfident. The z-score standard deviation, a measure of how well the uncertainty is calibrated, dropped from 2.63 to 1.22. Comparing new observations with the forecasts also flags unusual changes without any labels or retraining, raising F1 from 41.58 to 48.70 on a global anomaly benchmark. And because the forecasts live in embedding space, task heads already trained on those embeddings can be reused on them. The code is on GitHub.
4. Ai2 releases global 10 m embeddings from OlmoEarth v1.3
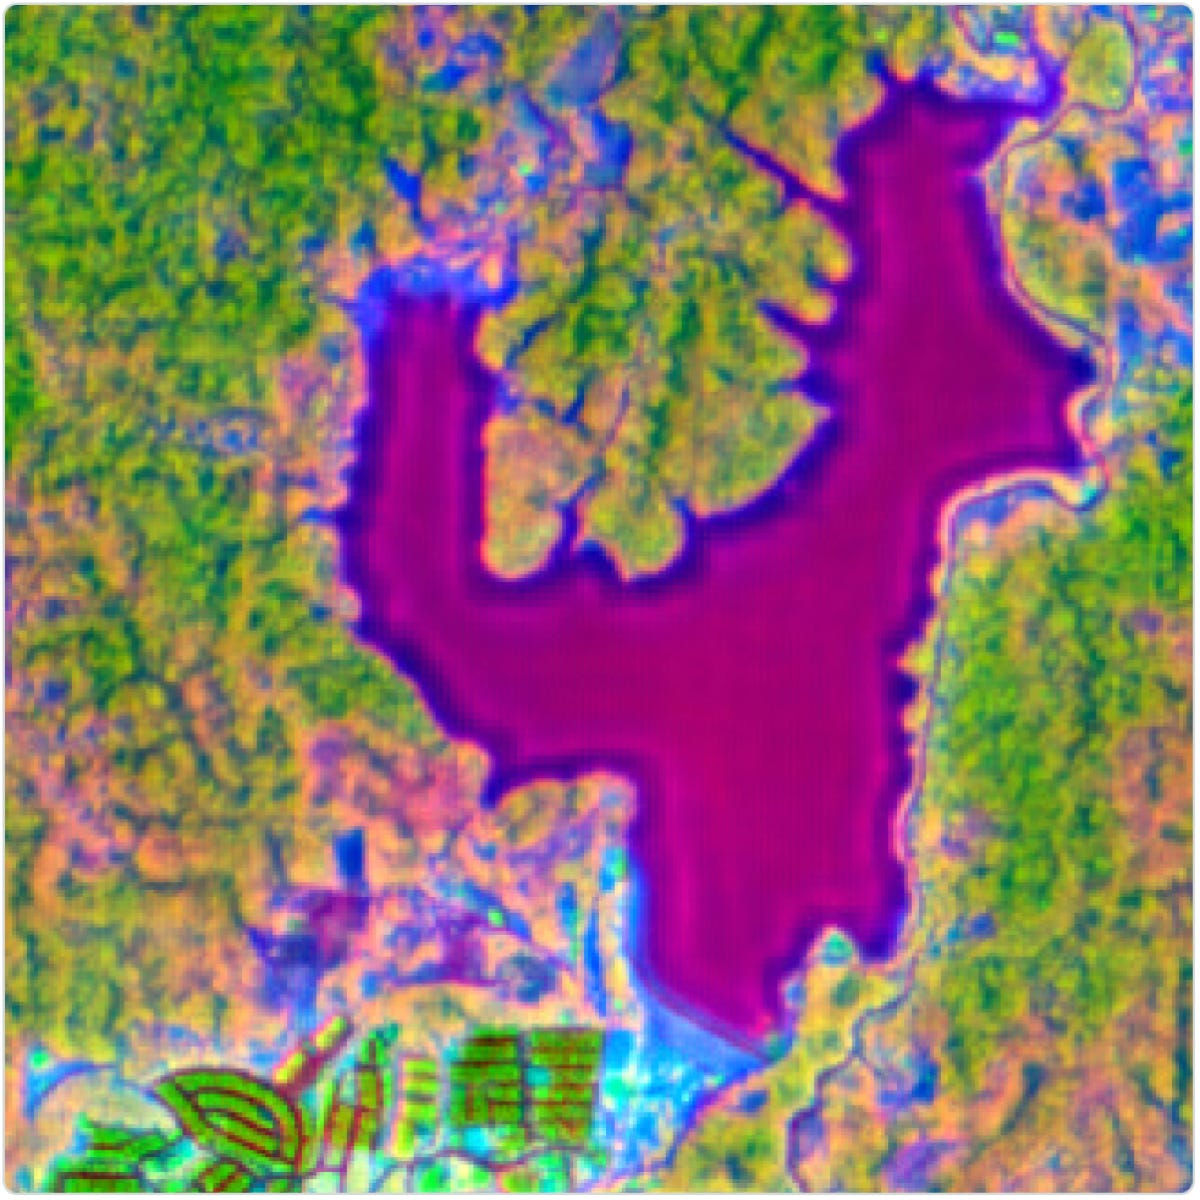
Running a big foundation model over large areas is expensive, which is why precomputed embeddings (compact summaries of each pixel’s satellite history) are catching on. With the previous OlmoEarth model, 98% of the cost of making maps at scale came from running the model itself. A new technical report from the Allen Institute for AI introduces OlmoEarth v1.3, which is built specifically to produce embeddings.
The model condenses Sentinel-1, Sentinel-2 and Landsat time series into a single 64- or 128-number vector for each 10 m pixel. An attention pooler learns how to weigh observations from different dates and sensors (for example, leaning on radar when clouds block the optical images) instead of just averaging them. A distillation step then compresses the model’s 768-dimensional outputs to 128 dimensions, and the first 64 of those also work as a smaller standalone embedding.
The 128-dimensional embeddings beat AlphaEarth Foundations and TESSERA v2 on 10 of 11 evaluation tasks, and the 64-dimensional version beat both on 7 of 11. Training also took just 18% of the GPU hours of OlmoEarth v1 and 53% of v1.2. The team has released annual 10 m embeddings globally for 2023 to 2025, plus selected countries from 2017 to 2022, at roughly 150 TB per year. They’re hosted openly on Source Cooperative as Zarr with no API key needed, and you can explore them in a web app. Note that the licence restricts military, defence-related and extractive uses.
Geospatial Datasets
1. DeepMind opens up the data behind WeatherNext 3
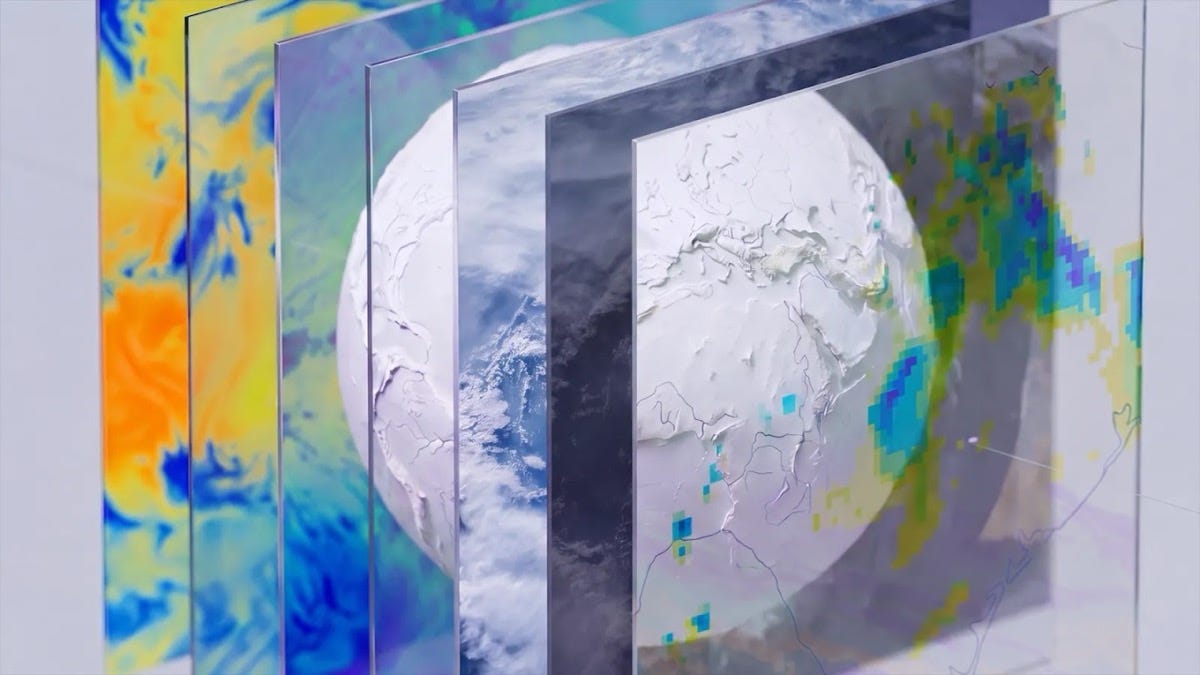
Google DeepMind has released PARDIG, a global precipitation dataset at about 10 km every 15 minutes covering 1999 to today, alongside SatWeave, an hourly global mosaic of 17 channels from geostationary weather satellites. You can access PARDIG here (including in Earth Engine) and SatWeave here.
2. 16 million segmentation masks for Earth observation
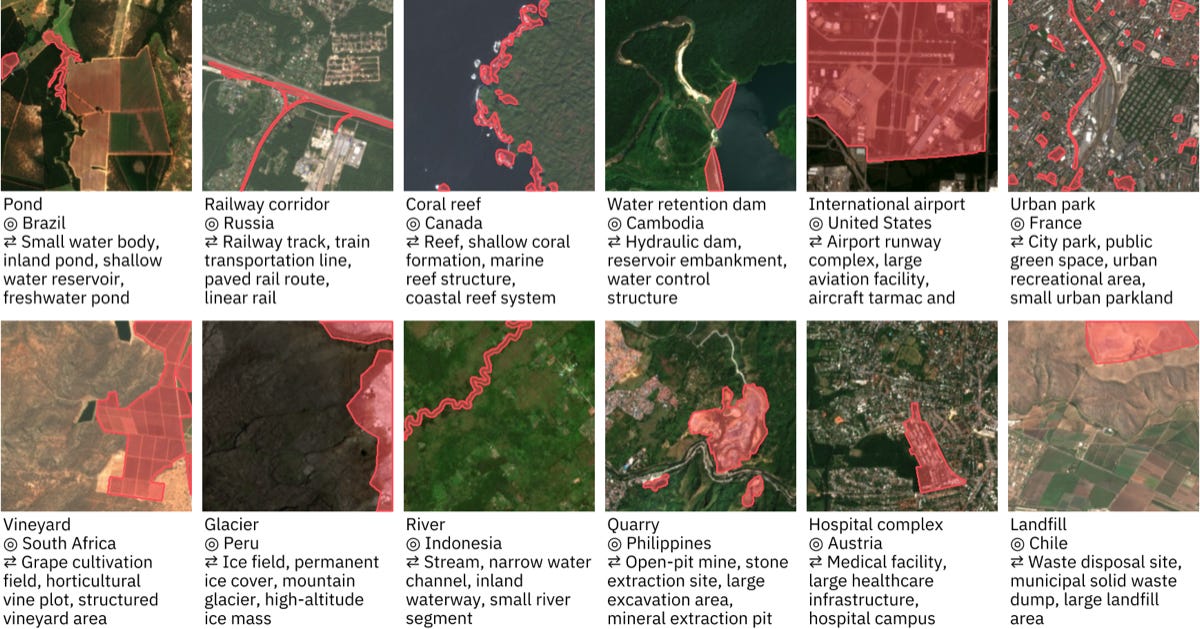
TerraMesh-Masks pairs about 9 million global 10 m samples (Sentinel-1, Sentinel-2, elevation, NDVI and land cover) with 16 million open-vocabulary segmentation masks from OpenStreetMap and Overture Maps, plus an expert-reviewed test set of 523 samples covering more than 200 classes. You can access the data here.
3. A global 10 m map of forest types
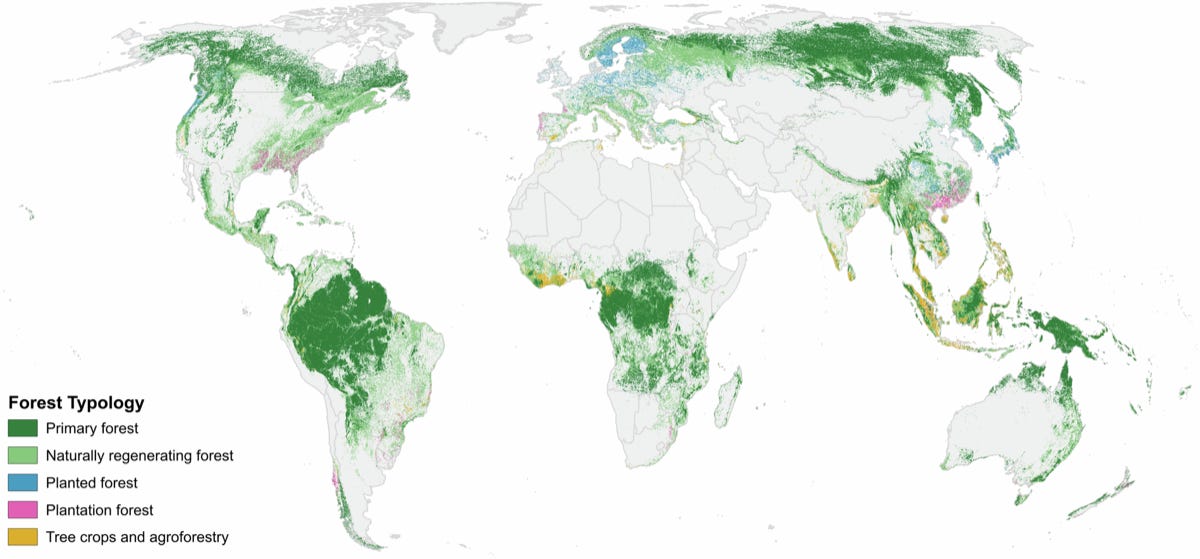
ForTy v1 maps the world’s forests at 10 m for 2020, separating primary, naturally regenerating, planted and plantation forests from tree crops and other land, with 90.2% overall accuracy against 8,190 expert-labelled sites. You can access the data here and the code here.
Other useful bits
JonaAI is now open source, turning plain-English questions like “show NDVI change for this farm over the last 90 days” into reproducible openEO workflows. It pulls Sentinel-2, Landsat, Sentinel-1 and Copernicus DEM data from STAC catalogues and exports GeoTIFFs, CSVs, HTML reports and Jupyter notebooks. It’s early days (the repo has a single commit), but it’s a nice example of LLMs being wired into real EO workflows.
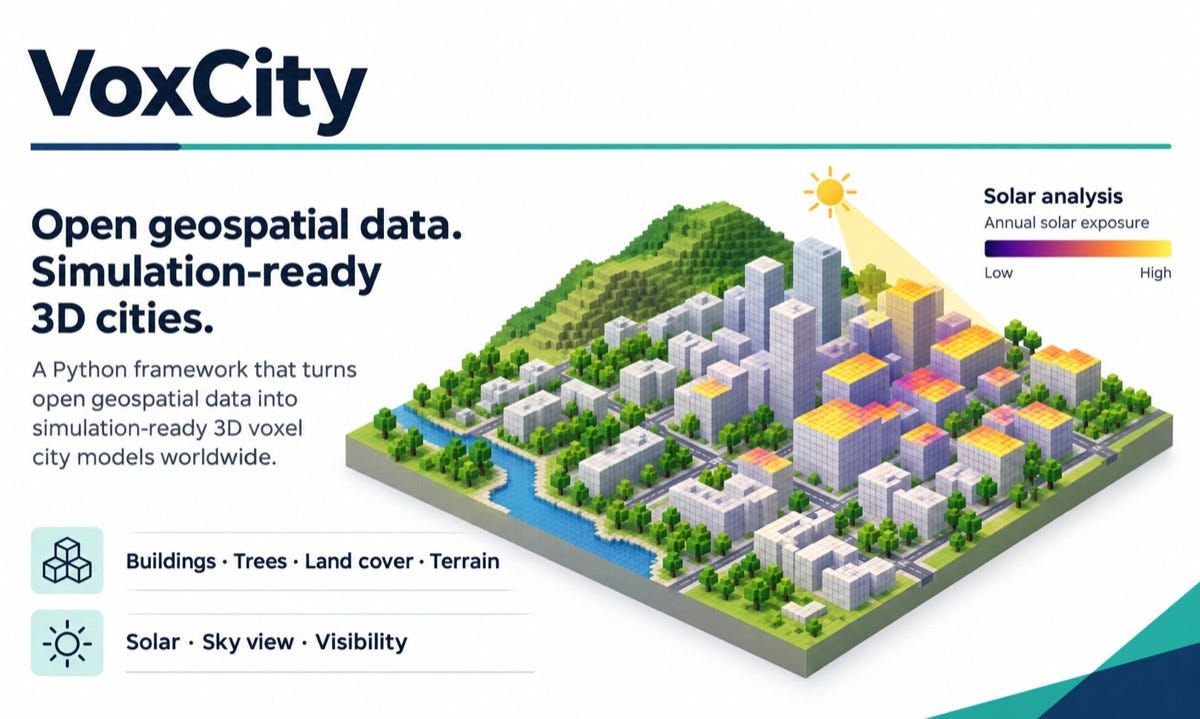
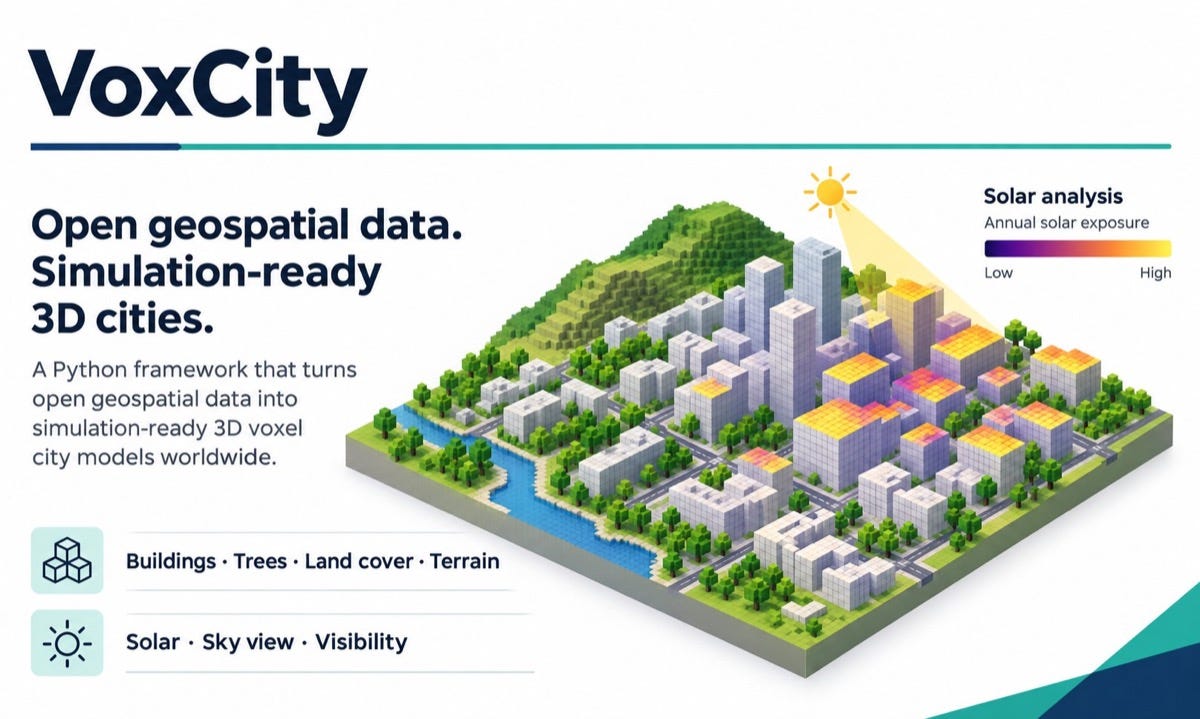
VoxCity is an open-source Python tool that builds a 3D voxel model of anywhere on Earth from open data on buildings, tree canopy, land cover and terrain. It can simulate solar irradiance and sky, green and landmark views, exports to ENVI-met, PALM and OBJ, and many of its default data sources don’t need an account. There’s a paper on it in Computers, Environment and Urban Systems.
Heads up if you’re using Sentinel-2B data from late October: ESA has flagged significant geolocation errors in a number of products acquired between 20 and 22 October 2026. The affected products are being removed from the Copernicus Data Space Ecosystem while the teams look into reprocessing them.
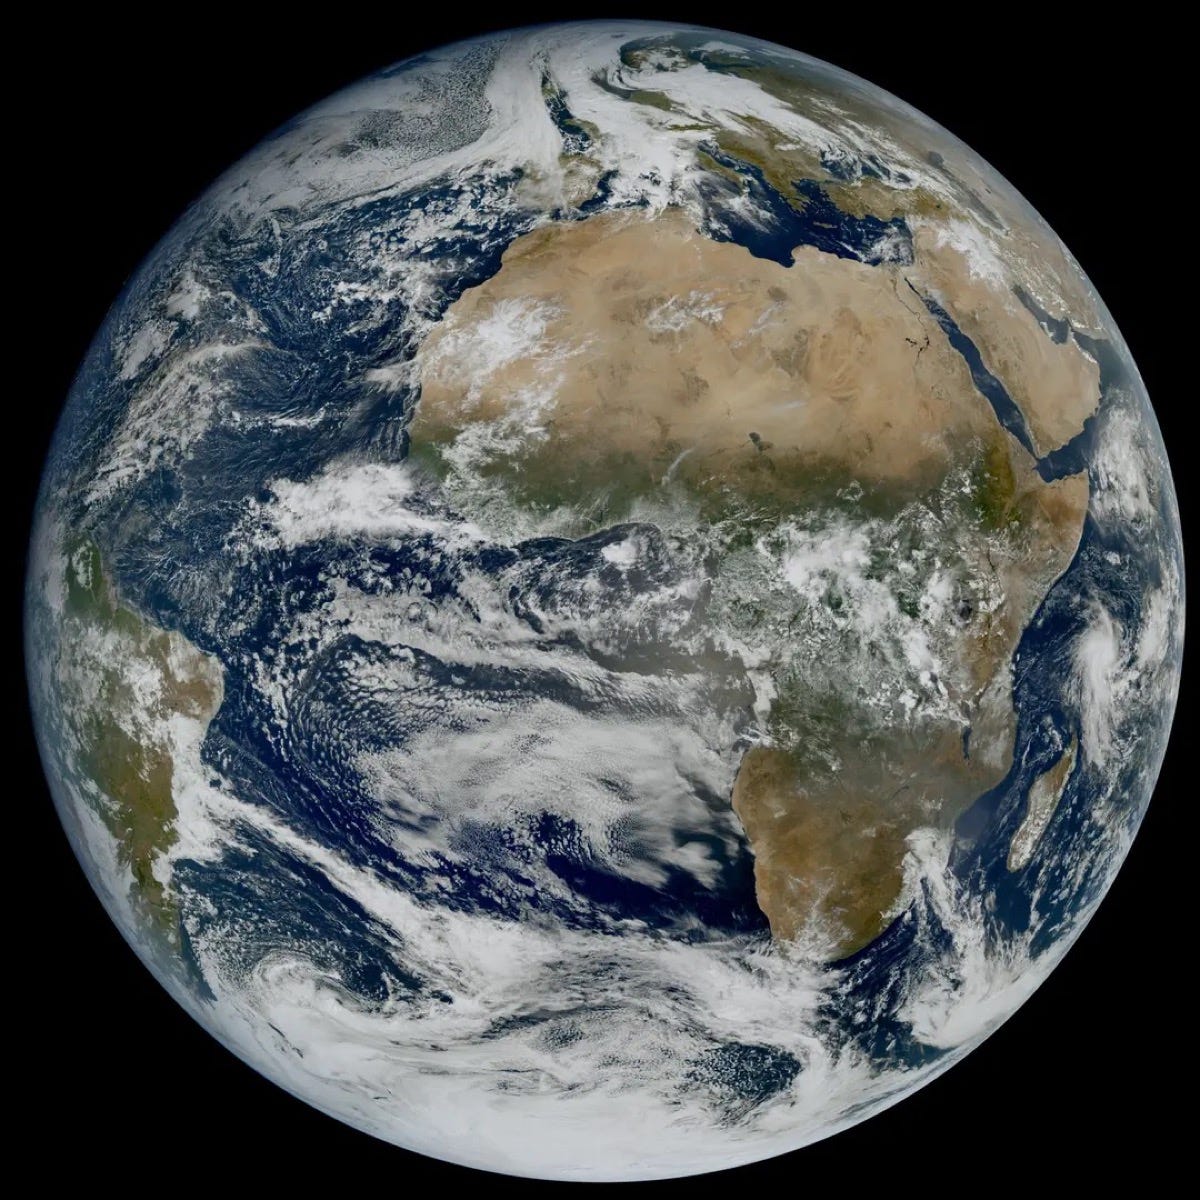
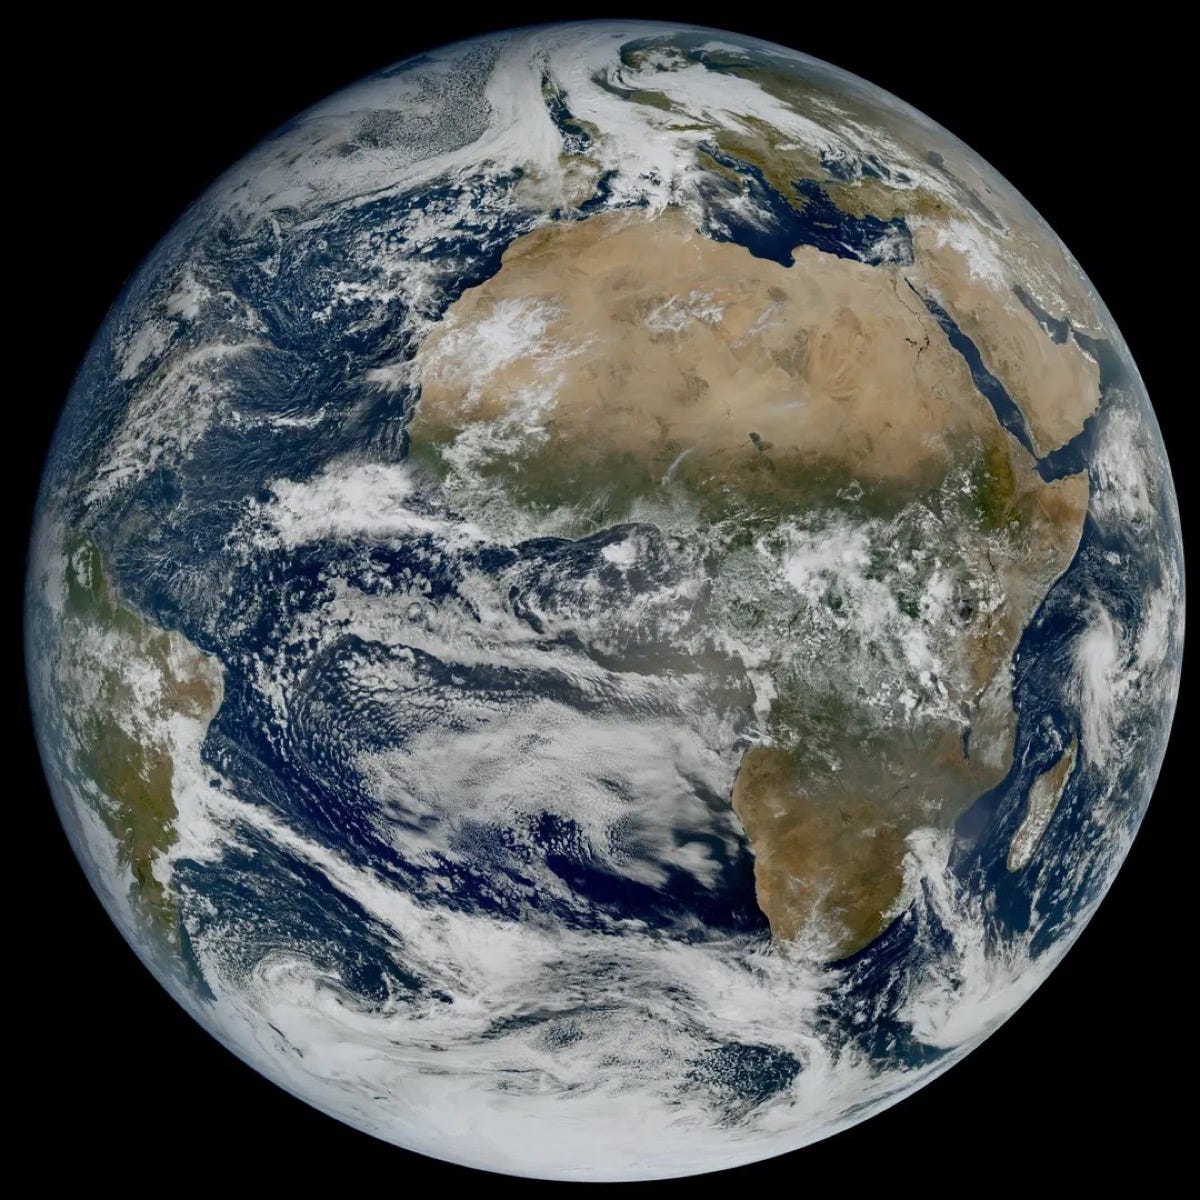
Europe’s second Meteosat Third Generation imager, MTG-I2, has delivered its first images, including a 45-hour animation at 2.5-minute intervals that picks up fog over central Europe, storm clouds over the Mediterranean and smoke from a wildfire in central Portugal. It’s still being calibrated, with operational service expected in Q2 2027.
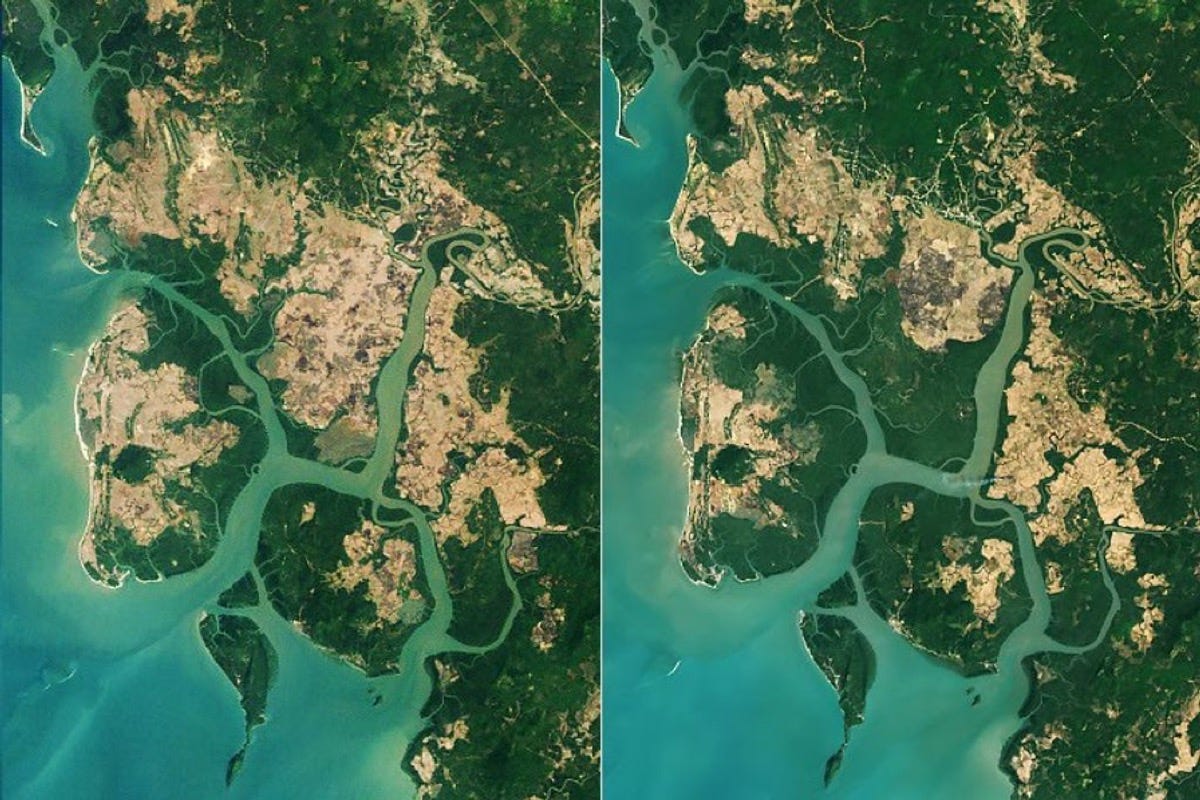
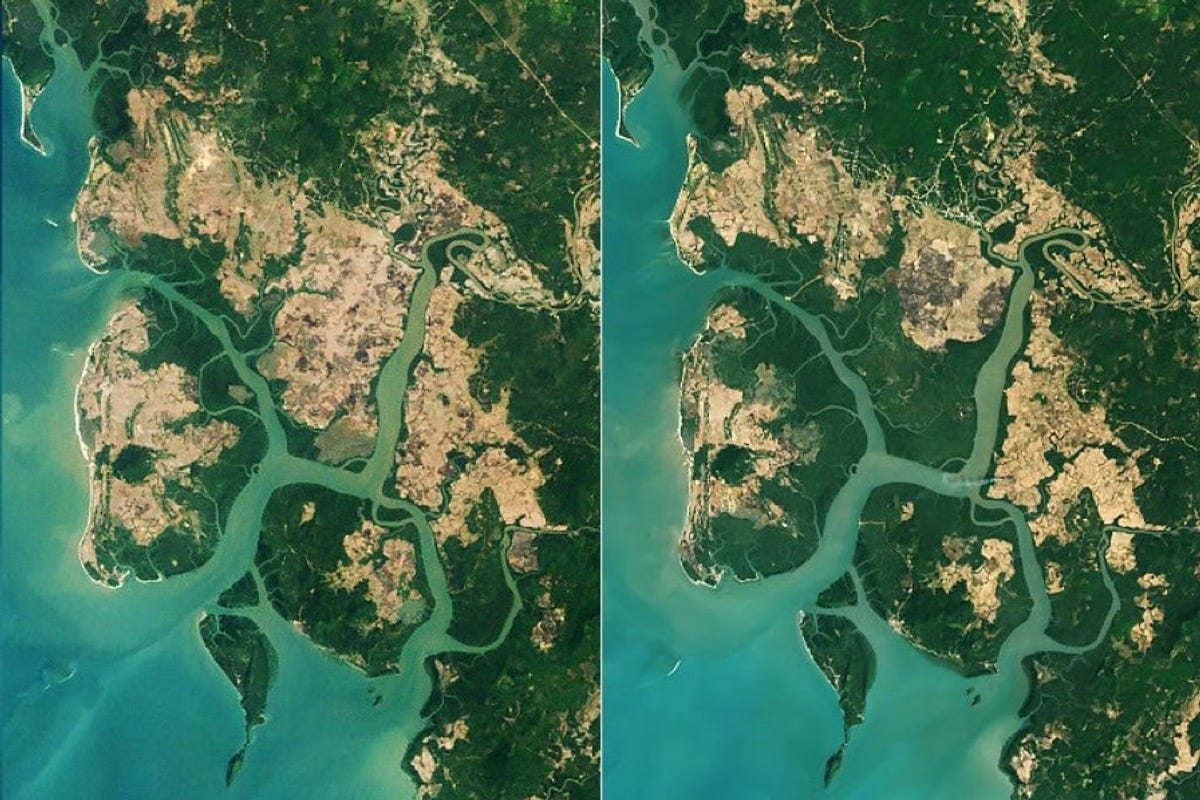
NASA Earth Observatory has highlighted a global rebound in mangroves, based on a new Landsat study in Science covering 1984 to 2023. Nearly 3,000 km² were lost between 1984 and 2010, but nearly 2,000 km² have been added since, about two-thirds of it from mangroves colonising new areas. Myanmar, which lost 28.6% of its mangroves between the 1980s and 2010, has grown its mangrove area by about 10% since.
Jobs
ICEYE is looking for a Senior Software Engineer, Flood Risk based in Espoo, Finland.
Mapbox is looking for a Machine Learning Engineer III, Routing Cost based remotely in the United Kingdom.
Planet is looking for a Senior Data Engineer, GMS Data Team based in Arlington, United States.
Overstory is looking for a Senior Solutions Engineer based remotely in the United States.
ICEYE is looking for a Geospatial Image Analyst (GEOINT) based in Espoo, Finland.
Just for Fun
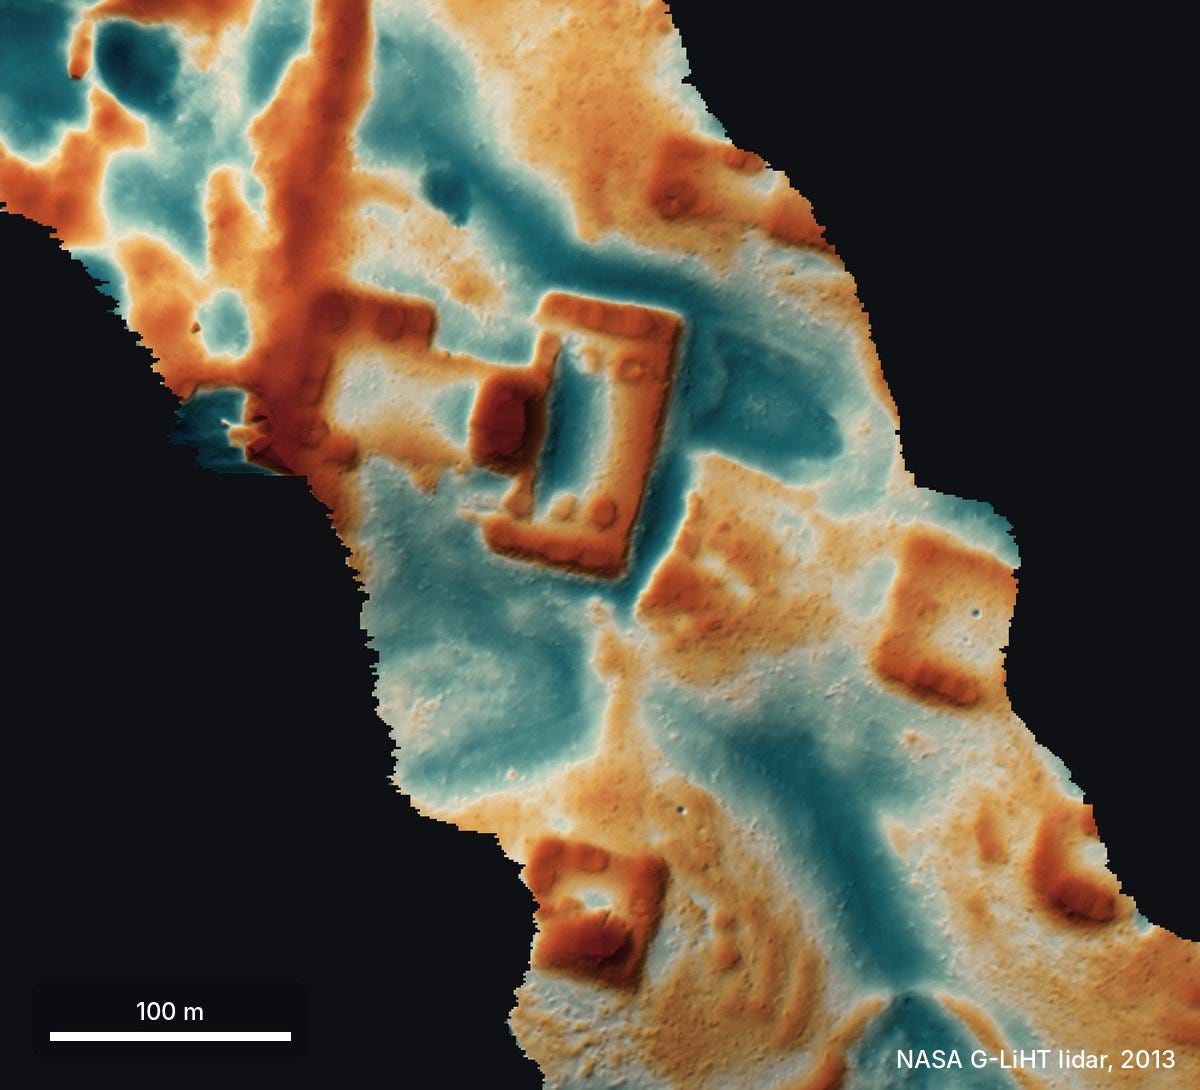
This bare-earth lidar view of a hilltop in Mexico shows a levelled plaza, an oval pyramid and several platforms hidden under 10 to 17 m of forest. Pietro Miotti had 48 AI agents scan about 1,200 km² of NASA lidar strips converted into images, and within about 72 hours sent a report to Mexico’s national archaeology institute (INAH), which replied that there was no registered site at that location. In a later update, he notes the site had already been mapped in a 2025 paper that the agents missed in their literature search, so it was a rediscovery rather than a new find.
Image: NASA G-LiHT lidar, via Pietro Miotti.
That’s it for this week.
I’m always keen to hear from you, so please let me know if you have:
new geospatial datasets
newly published papers
geospatial job opportunities
and I’ll do my best to showcase them here.
Yohan