

🌐 Your area estimates might be off
PLUS: Monitoring road damage from mobile phones, increasing the resolution of SAR images, and more.

Hey guys, here’s this week’s edition of the Spatial Edge — a newsletter that’s priced slightly better than your ArcGIS subscription. Our aim is to make you a better geospatial data scientist in less than five minutes a week.
In today’s newsletter:
Area Estimation: Map accuracy shapes sampling efficiency
Road Monitoring: Smartphone model detects damage in realtime
SAR Upscaling: Diffusion AI boosts radar image detail
Coastlines: Global tidal maps from WorldView imagery
SAR Fusion: New benchmark for optical–SAR object detection
Research you should know about
1. How map accuracy shapes area estimates from satellite data
Satellite-based maps are the main way we estimate land cover areas like forest extent or crop types. But there’s an issue I’m sure you’re aware of: maps aren’t perfect. And those imperfections affect how confident we can be in our estimates.
A new paper in Remote Sensing of Environment examines how classification accuracy shapes the efficiency of area estimates.
‘What is efficiency?’, I hear you ask.
You can think of ‘efficiency’ as how precisely we can estimate the true area of a land cover class (like forest or cropland) given a fixed number of reference samples. In other words, how few samples you need to reach a desired level of precision.
Stratification and why map accuracy matters
Most area estimates from satellite data start with a pretty simple count of how many pixels belong to each class. This approach is nearly always biased (classification maps contain errors from imperfect training data or get confused between similar land covers).
To address this, standard practice is to draw a sample of locations, check the real land cover there, and then use the map for stratification. This means the map guides where you sample, but the final area estimate relies on your reference data.
In this set-up, producer’s accuracy (which measures how often land is correctly labelled) and user’s accuracy (which measures how often mapped areas are correct on the ground) don’t introduce bias but they do affect efficiency. More accurate maps require fewer reference samples to reach the same precision, reducing time and cost.
What the study found
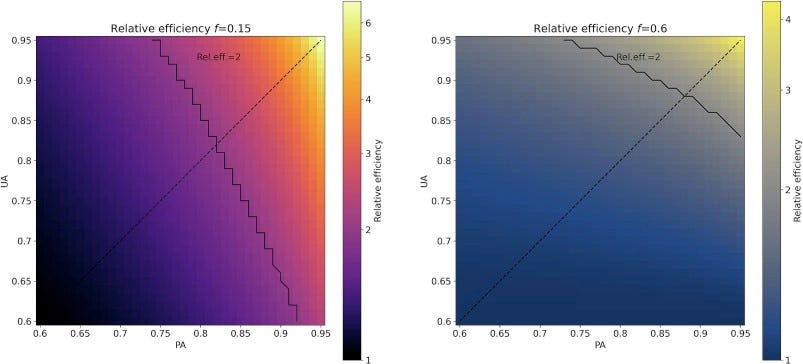
This study quantifies exactly how producer’s accuracy (PA) and user’s accuracy (UA) shape efficiency in stratified random sampling. The key points:
Even a fairly inaccurate map (for example, PA and UA at 0.6) improves efficiency over simple random sampling, particularly for rare classes.
For rare classes, producer’s accuracy matters most. Improving PA reduces required sample sizes more than UA does.
For common classes, user’s accuracy has more impact.
The effect is non-linear. Sometimes, a small boost in PA or UA leads to a large gain in efficiency, depending on the class proportion.
F-score, often used to judge map quality, is not a reliable guide to efficiency for area estimation. Two maps with the same F-score may have very different sampling efficiencies.
Implications for practice
If you want to estimate area, don’t just rely on pixel counts or select your map based on overall accuracy. Use stratified sampling, and focus on PA and UA for your class of interest. When your target is a rare class, increasing PA is the best fix. Even maps with moderate accuracy can significantly cut your sample size, reducing costs.
2. Road inspection, meet your smartphone
Inspecting roads for cracks and potholes is still done mostly by hand. It can be pretty slow, expensive, and doesn’t scale. Some places use AI-based systems, but they usually rely on massive servers, which essentially costs a lot.
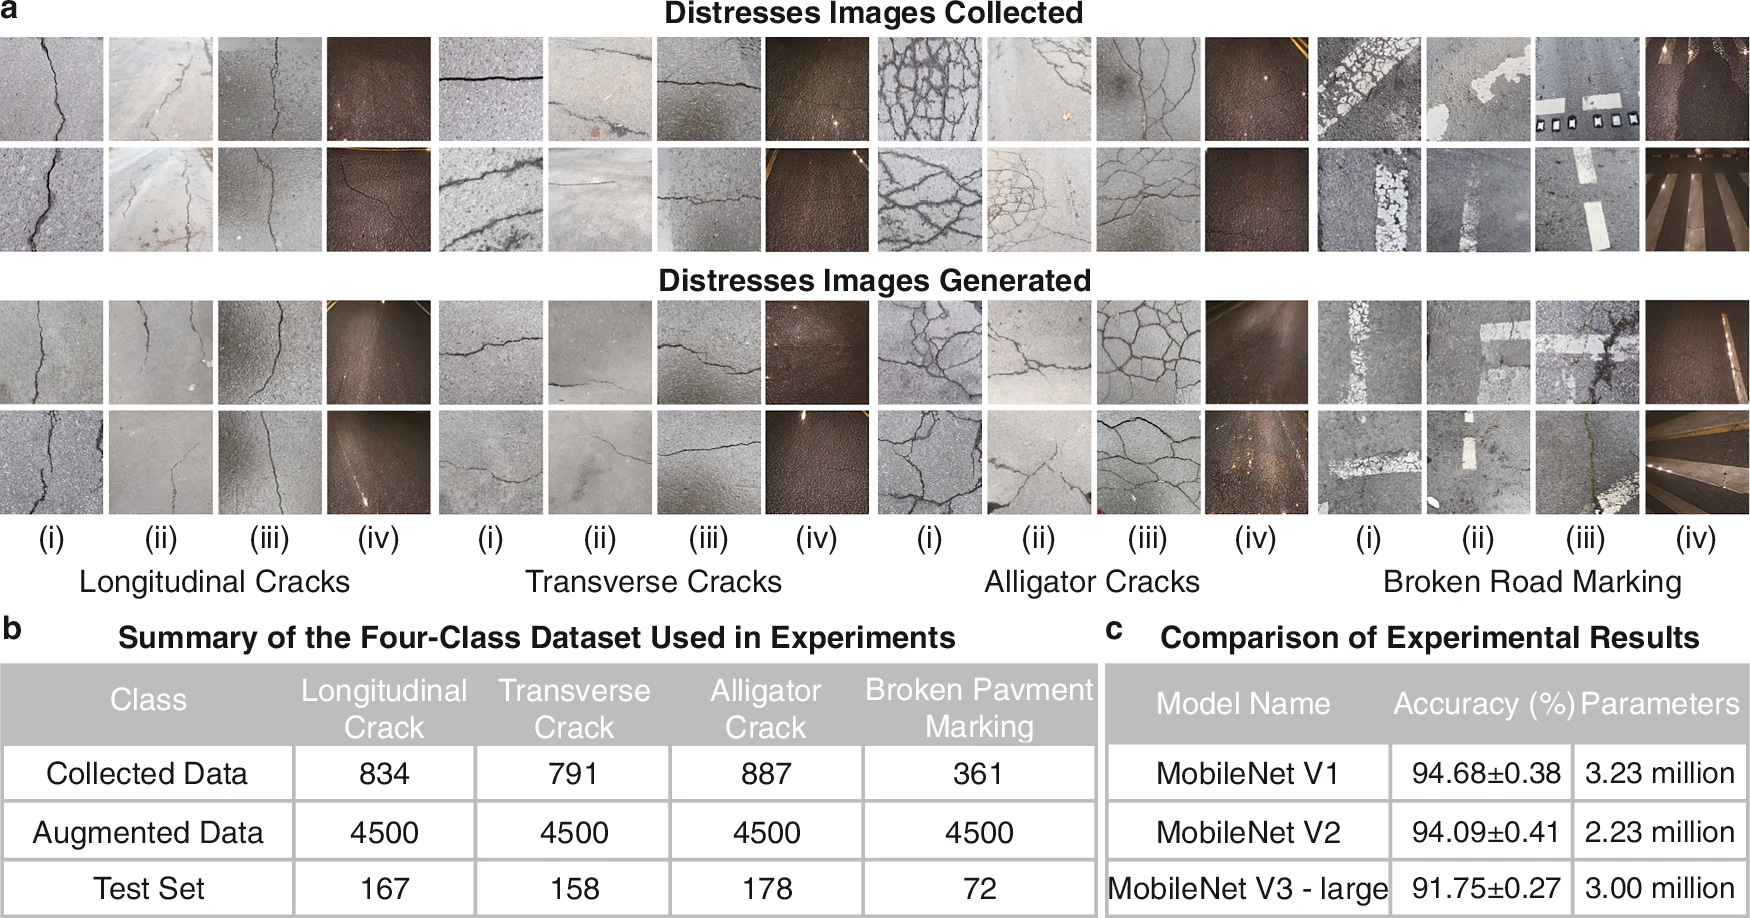
A new study in Nature Communications introduces MobiLiteNet, a lightweight deep learning model that runs on a smartphone. It detects road damage in real time and has been tested in real-world conditions, showing some pretty impressive results. This could be a big deal for infrastructure monitoring in cities with limited budgets or hard-to-reach areas.
The method: edge-optimised AI trained on diverse cracks
The team trained their model using images from Europe and Asia, including Germany, China, and the UK. These images capture different types of damage, and were collected in rain, at night, and from different angles.
To train a decent model with minimal computing needs, they used a few tricks:
Efficient Channel Attention (ECA): a lightweight way for the model to focus on key features.
Knowledge distillation: the model “learns” from a more powerful ResNet teacher model.
Pruning and quantisation: trims down the model’s size and converts it into a format that runs fast on phones.
The results: faster, smaller, just as accurate
The final model is just 0.6 MB (compared to 8.9 MB for the standard MobileNet V2) and can detect road damage in just 35 milliseconds on a smartphone. Its accuracy was 96.4%. This almost matching the heavyweight ResNet model, but with over 90% faster processing.
Bottom line: With MobiLiteNet, anyone with a smartphone can help inspect roads. It’s fast, cheap, and nearly as accurate as far more powerful models.
3. Can foundation models bridge the gap between satellite and airborne SAR?
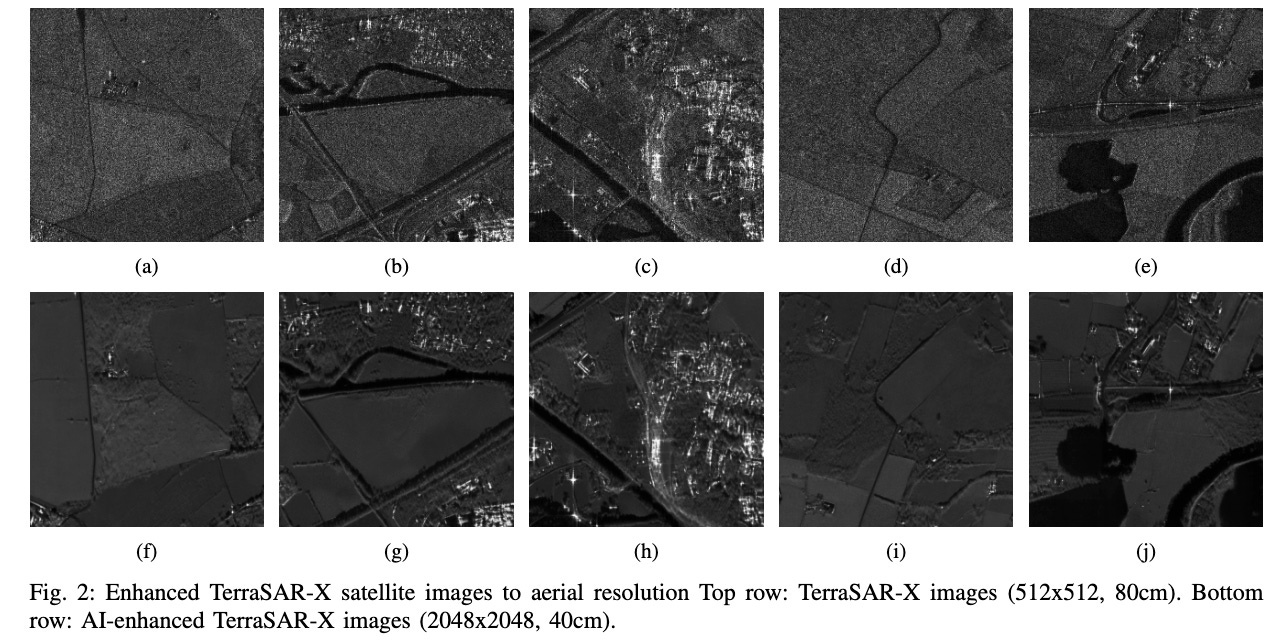
Airborne Synthetic Aperture Radar (SAR) provides sharper resolution and more detail than satellites. However, it’s costly and rare. Satellite SAR images are much easier to access, especially with open datasets like TerraSAR-X.
A new study from ONERA explores whether generative AI models can fill the gap by converting spaceborne SAR images into more detailed airborne-style ones.
They use a technique called latent diffusion, which is the backbone of image generators like Stable Diffusion. But instead of making cat pictures, they’re applying it to radar data to enhance both simulated and real SAR imagery. The goal is to improve spatial detail, smooth out noise, and make synthetic radar images more realistic.
How they did it: using diffusion models
The research team 15 years collecting airborne SAR images across southern France, building a huge dataset of 110,000 one-megapixel radar images. They used these to train a large AI model (Stable Diffusion XL, with 3.5 billion parameters), which was originally designed for generating optical images, not radar.
To get the model to work with SAR, the researchers used two techniques:
Transfer learning: They fine-tuned only part of the model to “teach” it the unique look and texture of SAR images, without erasing everything it learned from the much bigger world of optical imagery.
Spatial conditioning (ControlNet): They added a module that guides the AI using spatial information like edges and textures from the input image. This is a bit like giving the model a map so it doesn’t lose track of where roads, buildings, or rivers are as it increases the image resolution.
The training also involved matching SAR images to optical images from open data, ensuring the model could “see” the same location from different sensors.
What they found
The results are promising. The model smooths out noise in satellite SAR images and injects realistic detail into synthetic ones. The diffusion process acts as a denoiser, while ControlNet helps preserve structure and edge information. However, some textures and patterns unique to SAR data weren’t fully captured.
Still, this is an interesting proof of concept. With more targeted fine-tuning, I could see this approach becoming quite valuable for anyone working with radar imagery.
Geospatial Datasets
1. Multi-use land use dataset
MSLU-100K is a large, high-quality land use dataset with over 100,000 irregular parcels across 81 Chinese cities. It offers 7 major and 28 secondary classes.
2. Coastline and intertidal zone dataset

This new global dataset provides high-res (2 m) coastlines, intertidal zones, and water probability maps from ~1.3 million WorldView-2 and 3 images (2009–2023). You can access the data here and the code here.
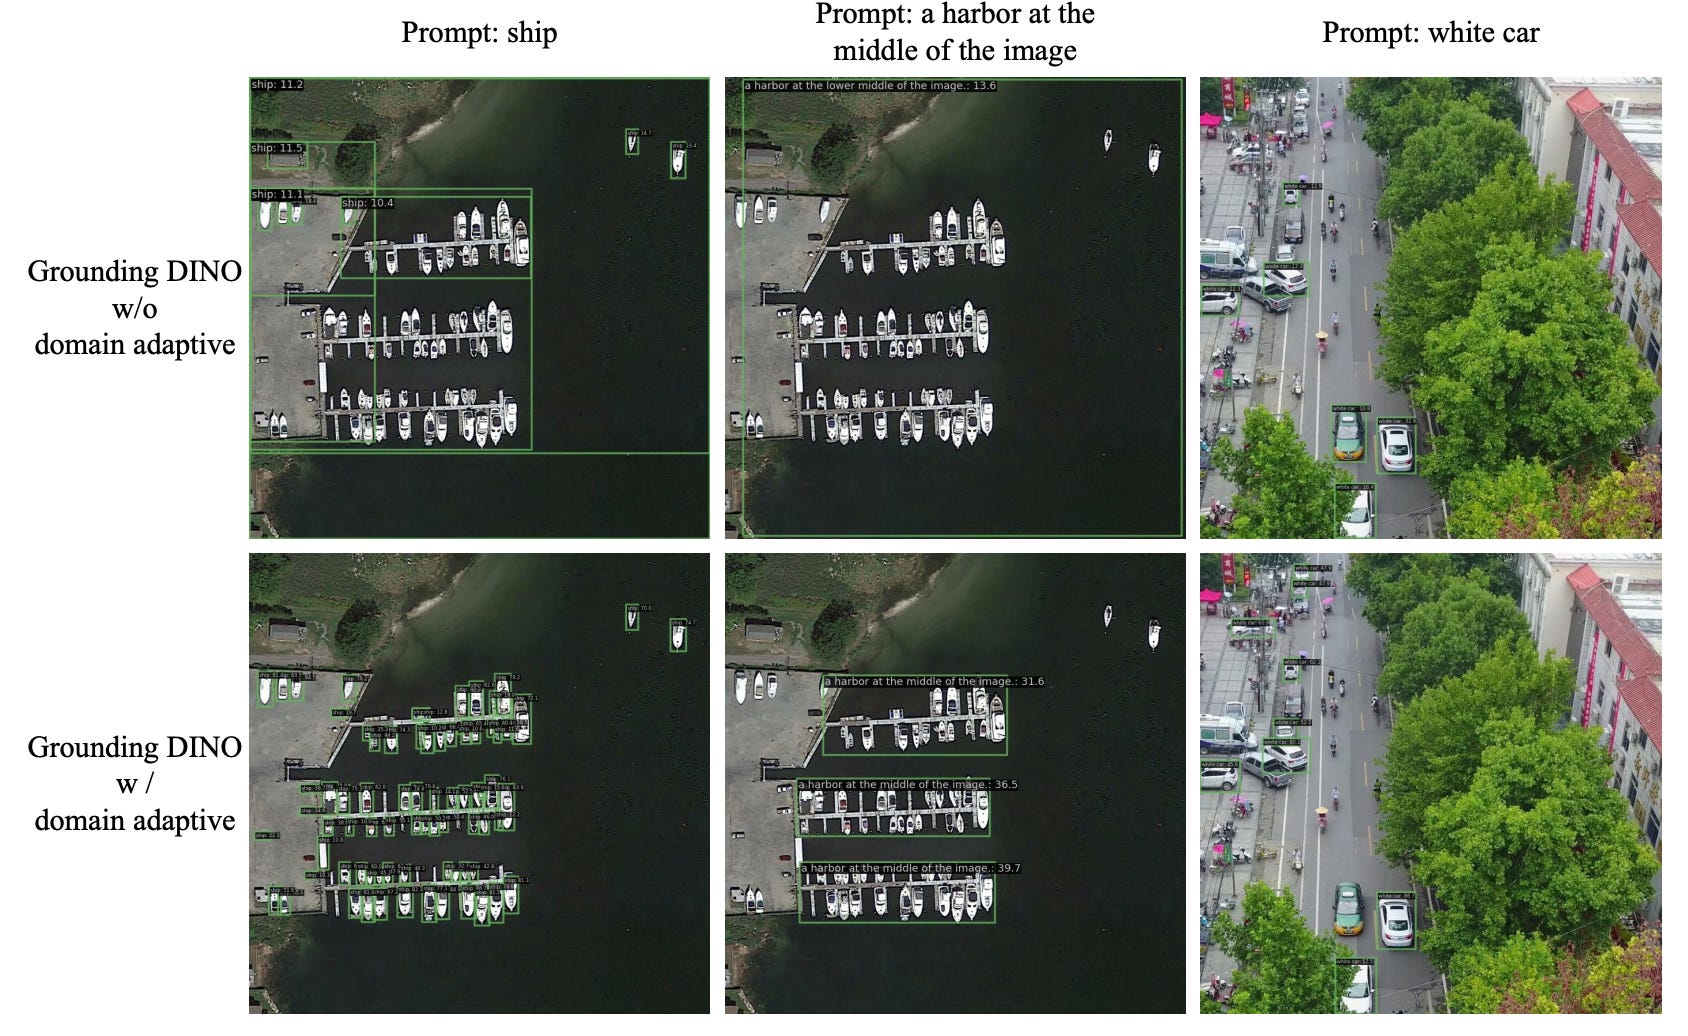
3. M4-SAR dataset and E2E-OSDet framework

A team of researchers has introduced M4-SAR, the first large-scale, high-quality benchmark for object detection using optical and SAR image fusion. The dataset contains over 112,000 precisely aligned image pairs from Sentinel-1 and Sentinel-2, annotated with nearly 1 million instances across six categories (bridges, harbours, oil tanks, playgrounds, airports, wind turbines). You can access the dataset and code here.
Other useful bits
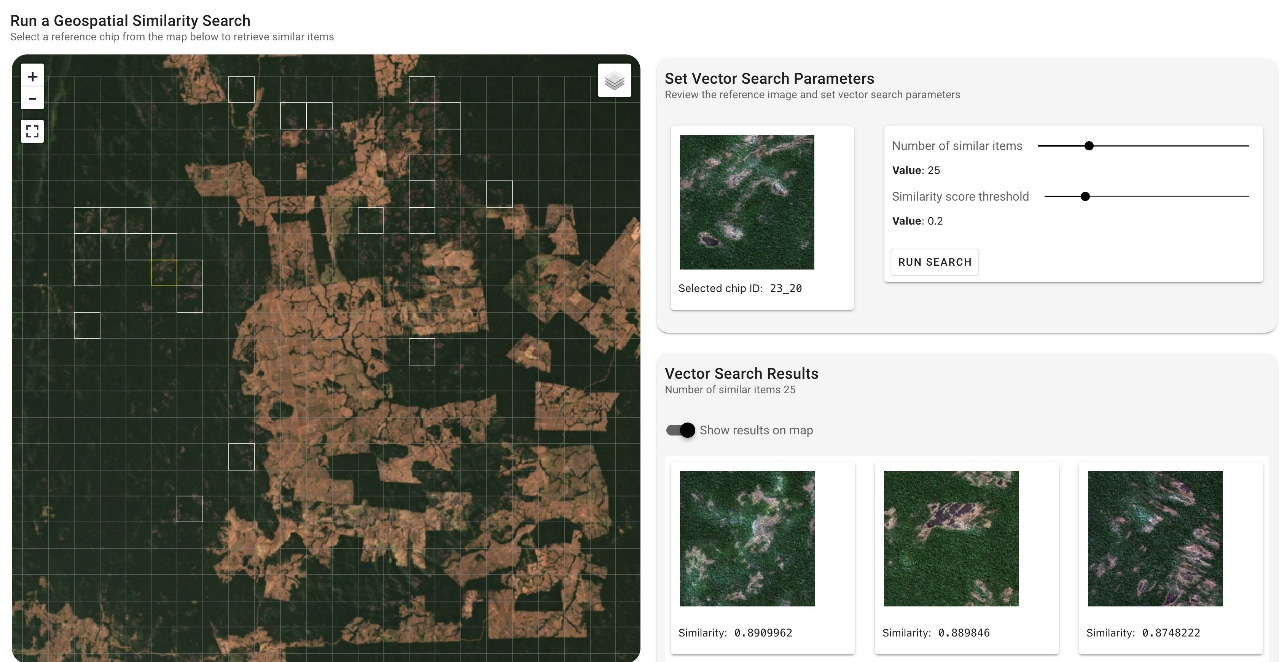
Geospatial foundation models (GeoFMs) are everywhere these days within the Earth observation space. A new AWS workflow shows how models like Clay can spot deforestation in the Amazon, track ecosystem change, and even classify land use with minimal labelled data. It’s all open-source and ready to deploy. Check out the accompanying GitHub repo.
PMI is using geospatial data to track deforestation, water use, and biodiversity risks across its global supply chain. The in-house system provides near real-time satellite insights at 10-metre resolution, supporting zero-deforestation goals and nature-based decisions.
A new MSCI study found that 41% of global assets in its benchmark index face at least one high environmental risk. This is most commonly poor air quality, water scarcity, and declining timber resources. With nature loss affecting supply chains and costs, geospatial tools are becoming more important in identifying hidden risks.
SAR is powerful but fragmented. This blog post reflects on a major barrier in using SAR data for disaster response: poor interoperability between public and commercial missions. Despite strong data availability, the lack of consistent processing tools limits rapid, effective use after disasters. To tackle this, they’ve begun developing MultiRTC, a Python package that applies consistent radiometric terrain correction (RTC) across SAR datasets.
Jobs
Ai2 is looking for a Lead Research Engineer for Earth System based in Seattle.
Mapbox is looking for a Machine Learning Engineer III for Location AI based in the UK.
Wildlife Conservation Society (WCS) is looking for a Wildlife Biology Technician based in Edmonton.
IMPACT Initiatives is looking for a Global GIS Specialist based in Geneva.
The Environmental Defense Fund is looking for a Postdoctoral Science Fellow in MethaneSAT Science.
Image of the week

This image from Copernicus shows the collapse of the Birch Glacier in the Swiss Alps, triggering a massive landslide that hit the village of Blatten. An estimated 3 million cubic metres of debris surged downhill…
That’s it for this week.
I’m always keen to hear from you, so please let me know if you have:
new geospatial datasets
newly published papers
geospatial job opportunities
and I’ll do my best to showcase them here.
Yohan
what metrics do you think are most useful in evaluating the performance of diffusion models like ONERA’s? how do quantify the success of “more detail”