

🌐 A better way of predicting earthquake damage
PLUS: Tracking fast-moving disasters from space, optimising wind farm locations, and more.

Hey guys, here’s this week’s edition of the Spatial Edge — we’re sort of like the R of the geospatial world. Free, intuitive, but for some reason people still keep going back to Stat…In any case, the aim is to make you a better geospatial data scientist in less than five minutes a week.
In today’s newsletter:
Earthquake Risk: Bayesian models predict building-level damage.
Disaster Tracking: High-frequency satellites monitor fires and storms.
Wind Siting: AI identifies optimal wind farm locations.
Smart Farming: Decentralised AI improves pest management.
Field Mapping: Three billion agricultural fields mapped globally.
Research you should know about
1. Predicting earthquake damage with physics and statistics
Earthquakes pose a massive threat to dense urban areas, but predicting exactly how a city will hold up during a major tremor can be pretty complex. Standard risk assessments often rely on simplified charts or historical data, which can miss the nuanced structural differences between individual buildings. A new paper from Scientific Reports presents a large-scale seismic risk framework that combines rigorous physics-based structural modelling with the predictive power of Bayesian networks. By focusing on District 2 of Tehran as a case study, the team managed to evaluate thousands of buildings to map out precise zones of vulnerability.
The researchers categorised the district’s buildings based on their age, number of storeys, and structural materials (such as steel or reinforced concrete). They then ran intensive simulations to see how each building type would react to varying earthquake intensities. Because it’s obviously impossible to perfectly predict every variable in a sprawling city, the team fed their simulation results into a Bayesian probabilistic network, which is a statistical model that excels at handling uncertainty. The results revealed that newer buildings generally fare better, but specific vulnerabilities stood out. For instance, reinforced concrete structures were more prone to damage from horizontal shifting (drift), while steel buildings suffered more from raw shaking acceleration. Alarmingly, the model pinpointed two specific zones in the district facing up to a 59% chance of complete destruction in a severe earthquake.
This granular, data-driven approach gives city planners and emergency responders a bit more of a sharper tool for identifying weak points in urban infrastructure before disaster strikes.
2. Tracking fast-moving disasters from space
As climate-related disasters like wildfires and flash floods become more frequent and severe, the need for real-time monitoring from space has never been greater. Earth Observation (EO) models powered by artificial intelligence have made massive leaps recently, with developers building geospatial foundation models (more on that here and here), that are trained on vast amounts of unlabelled satellite imagery. However, nearly all of these existing models are trained on imagery from polar-orbiting satellites, which provide incredibly detailed, high-resolution pictures but only pass over the same spot on Earth every few days. This makes them entirely unsuitable for tracking fast-moving, dynamic events like a rapidly spreading forest fire or a developing storm system.
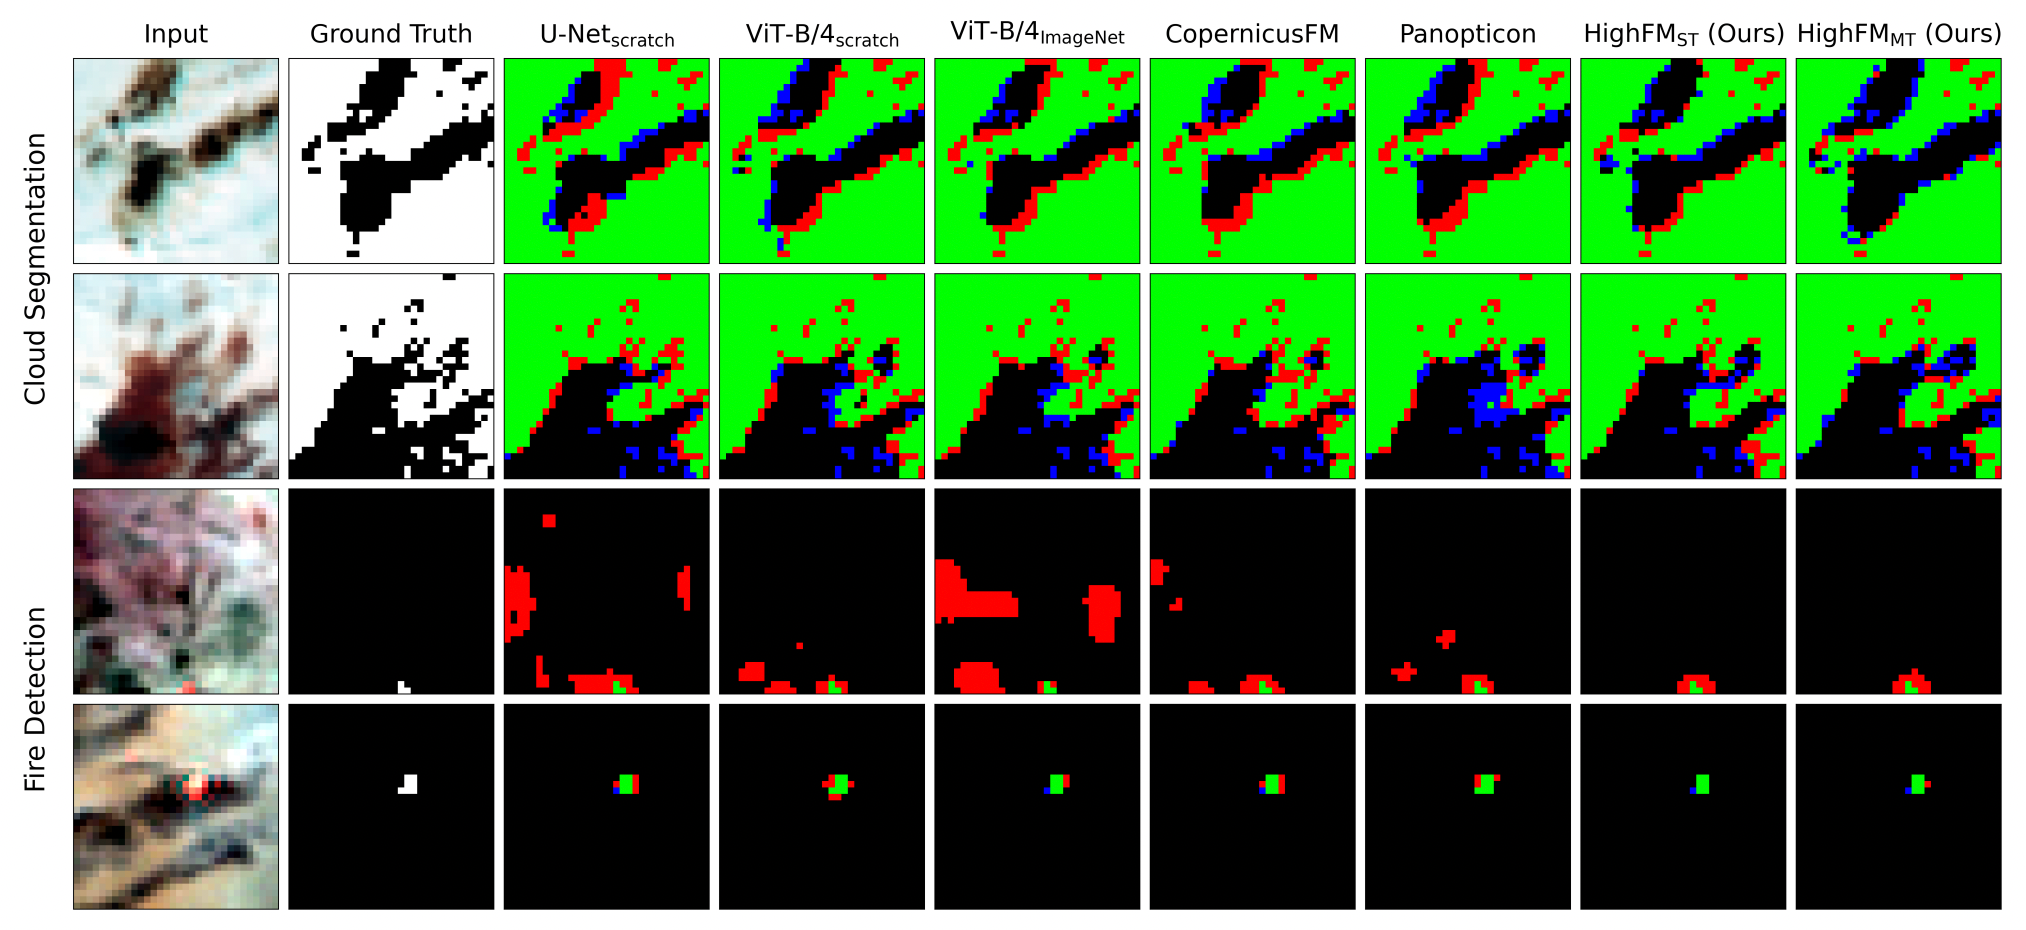
A new study introduces HighFM, a new foundation model explicitly designed for high-frequency environmental monitoring. Instead of using highly detailed but infrequent images, the team trained their model on more than 2 terabytes of imagery from the Meteosat Second Generation platform. These geostationary satellites provide lower-resolution images but update every 15 minutes, offering a near-constant view of the Earth. To handle this unique data, the researchers adapted a masked autoencoder architecture to retain fine-grained, minute-by-minute temporal information that other models typically discard.
To test HighFM, the researchers asked the model to identify active fires and map cloud cover. When benchmarked against traditional AI models and even other state-of-the-art EO foundation models, HighFM consistently proved superior. The model’s ability to understand the rapid, short-term variability between images allowed it to detect fires and clouds with greater accuracy and fewer false alarms. The researchers noted that while HighFM was specifically tested on fire and cloud detection, the architecture could easily be adapted for tracking other rapid phenomena, like storm development or solar energy forecasting, offering a powerful new tool for civil protection and disaster response agencies.
3. Optimising wind farm locations in data-scarce regions
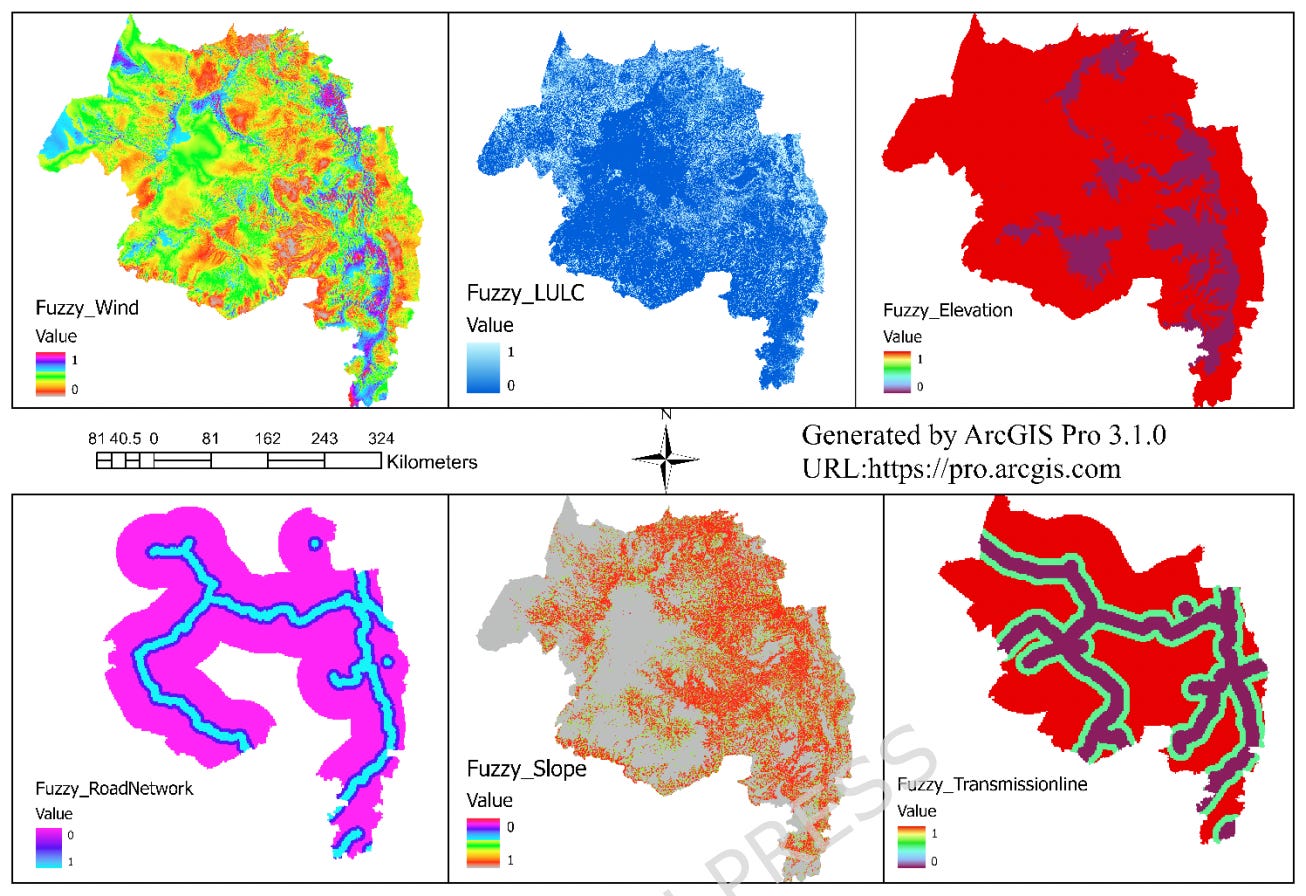
Wind power is a pretty important part of the global transition to renewable energy, but building a wind farm is an incredibly expensive long-term investment. To ensure a wind farm is economically viable, planners need to carefully select sites based on a bunch of technical, environmental, and socio-economic factors. Typically, researchers use Multi-Criteria Decision-Making (MCDM) tools, which rely on expert opinions to weigh factors like wind speed, terrain slope, and proximity to roads. However, these methods are pretty static, pretty subjective, and unable to predict the suitability of locations that haven’t been directly sampled. A new paper from Scientific Reports introduces a new framework that uses expert knowledge, objective efficiency analysis, and predictive machine learning to identify the best wind farm locations in the data-scarce Amhara Region of Ethiopia.
The framework operates in three stages. First, a Fuzzy Analytic Hierarchy Process (FAHP) was used to gather and weight expert opinions, identifying wind speed and proximity to power grids as the most critical factors while smoothing out the vagueness inherent in human judgment. Second, Data Envelopment Analysis (DEA) was applied to objectively measure the efficiency of these candidate zones, pinpointing the North Shewa zone as the absolute best location for converting available land and wind into energy output. Finally, the researchers trained three machine learning models (Random Forest, SVM, and XGBoost) on the FAHP-DEA data. The Random Forest model proved to be the most accurate, learning the complex spatial patterns to predict wind farm suitability across a massive 31-million-pixel map of the region.
This integrated approach successfully delineated 1,698 square kilometres of high-priority land within North Shewa, divided into two distinct development corridors. These findings were strongly corroborated by independent engineering assessments and the Ethiopian government’s own development pipeline. By successfully combining subjective expert weighting, objective efficiency screening, and machine learning generalization, this framework provides a highly accurate, scalable blueprint for strategic wind energy planning that can be easily adapted for other developing regions worldwide.
4. A smart farming framework for pest management
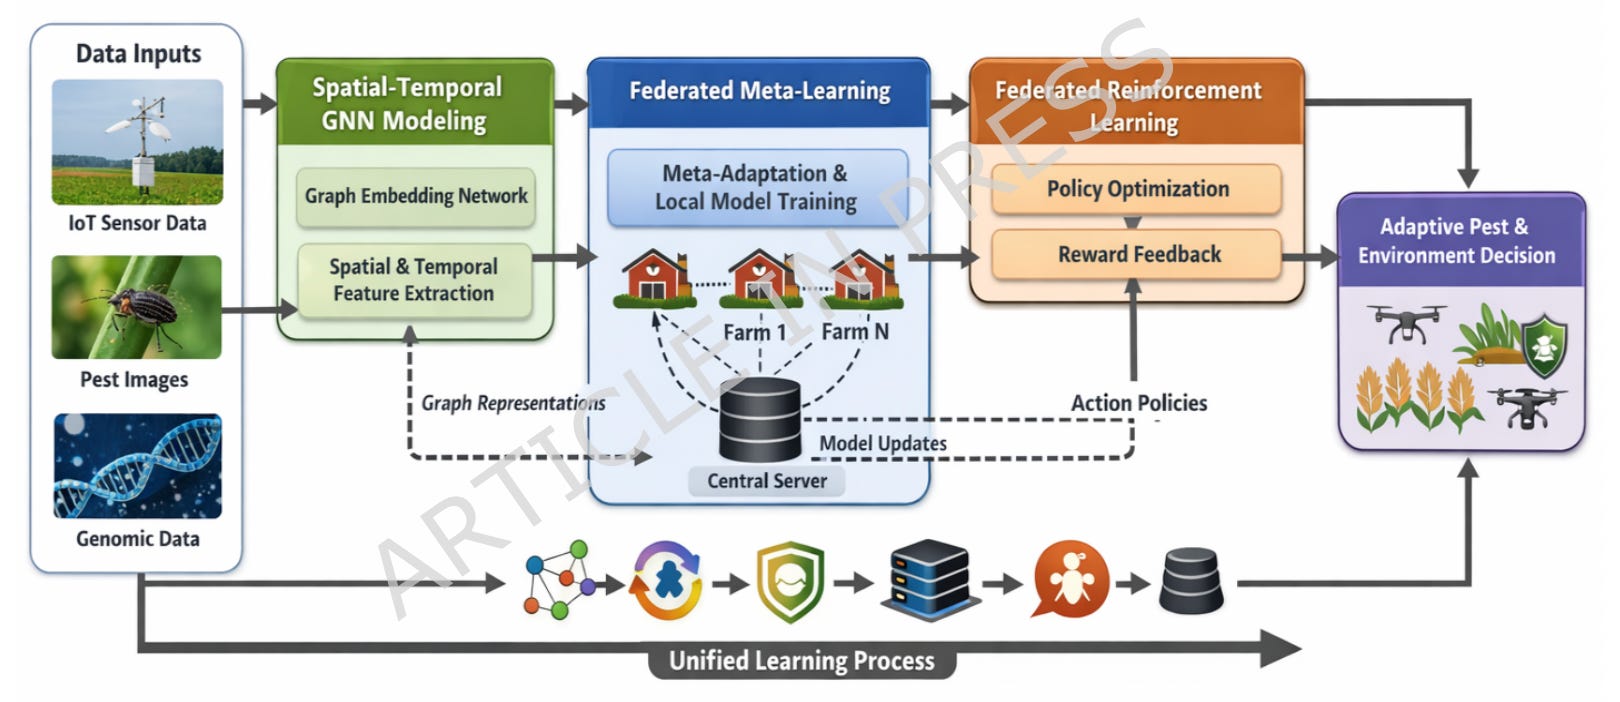
Sustainable agriculture faces massive challenges from unpredictable climate changes, varying soil conditions, and sudden pest outbreaks. Precision agriculture aims to solve these problems by using sensors and AI to manage farms efficiently. However, models like Convolutional Neural Networks (CNNs) struggle to understand the complex, real-world relationships between weather, soil, and crops. Furthermore, centralising data from multiple farms onto a single server creates privacy and bandwidth issues. To tackle these challenges, a team of researchers developed GNN-ML-FRL, a highly advanced, decentralised AI framework designed to identify pests and model environmental factors across diverse farming regions.
This new framework combines three techniques. First, Graph Neural Networks (GNNs) map out the spatial relationships between different sensors and farm plots, allowing the system to understand how a pest outbreak in one area might affect a neighbouring field. Second, Federated Learning (FL) enables different farms to collaboratively train the AI without ever sharing their private, raw data with a central server. Finally, Meta-Learning (ML) and Reinforcement Learning (RL) allow the system to rapidly adapt to new, unseen environmental conditions and make real-time decisions, such as optimising irrigation or pesticide use.
When tested against a massive dataset containing over 52 million environmental sensor readings and 75,000 images of insect pests, the GNN-ML-FRL framework outperformed all standard AI baselines. It achieved an 89.3% accuracy rate in pest identification and demonstrated a significant reduction in prediction errors across geographically unseen farms. The researchers also used the framework to analyse genetic crop data, proving its versatility. Ultimately, this scalable, privacy-preserving AI system offers a robust blueprint for the future of sustainable, data-driven farming. You can access the code here.
Geospatial Datasets
1. Global agricultural monitoring and field boundary dataset
The collection integrates a multi-source framework that combines high-resolution spatial mapping with continuous biophysical tracking to capture field-level dynamics and macro-scale crop conditions. This maps over 3 billion agricultural field units at a 10-metre resolution across 241 countries and territories. You can access the FOTW project here and the GEOGLAM Crop Monitor here.
2. High-resolution canopy height dataset
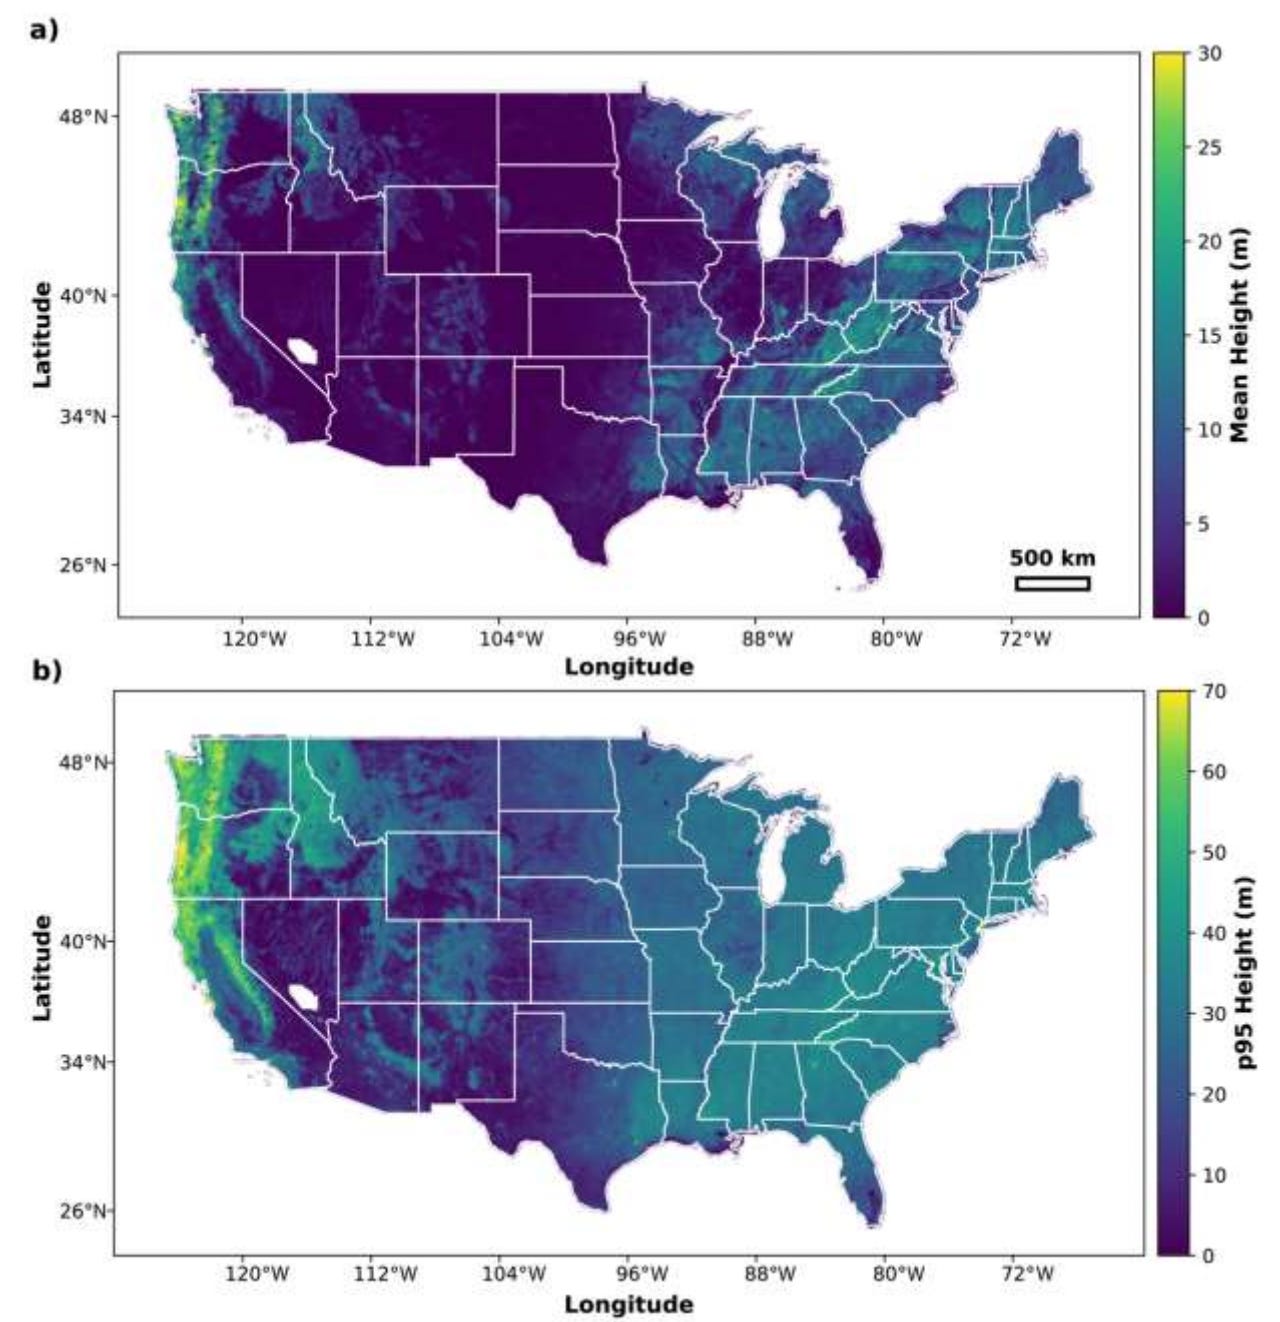
The NAIP-CHM dataset provides a continuous 0.6-metre resolution canopy height and vertical structure model across the US. Derived from National Agriculture Imagery Program aerial imagery spanning 2012 to 2023, the dataset characterizes the full vertical profile of the landscape, mapping both natural vegetation heights and human-made infrastructure. You can access the data here and the code here.
3. Text-guided object counting dataset
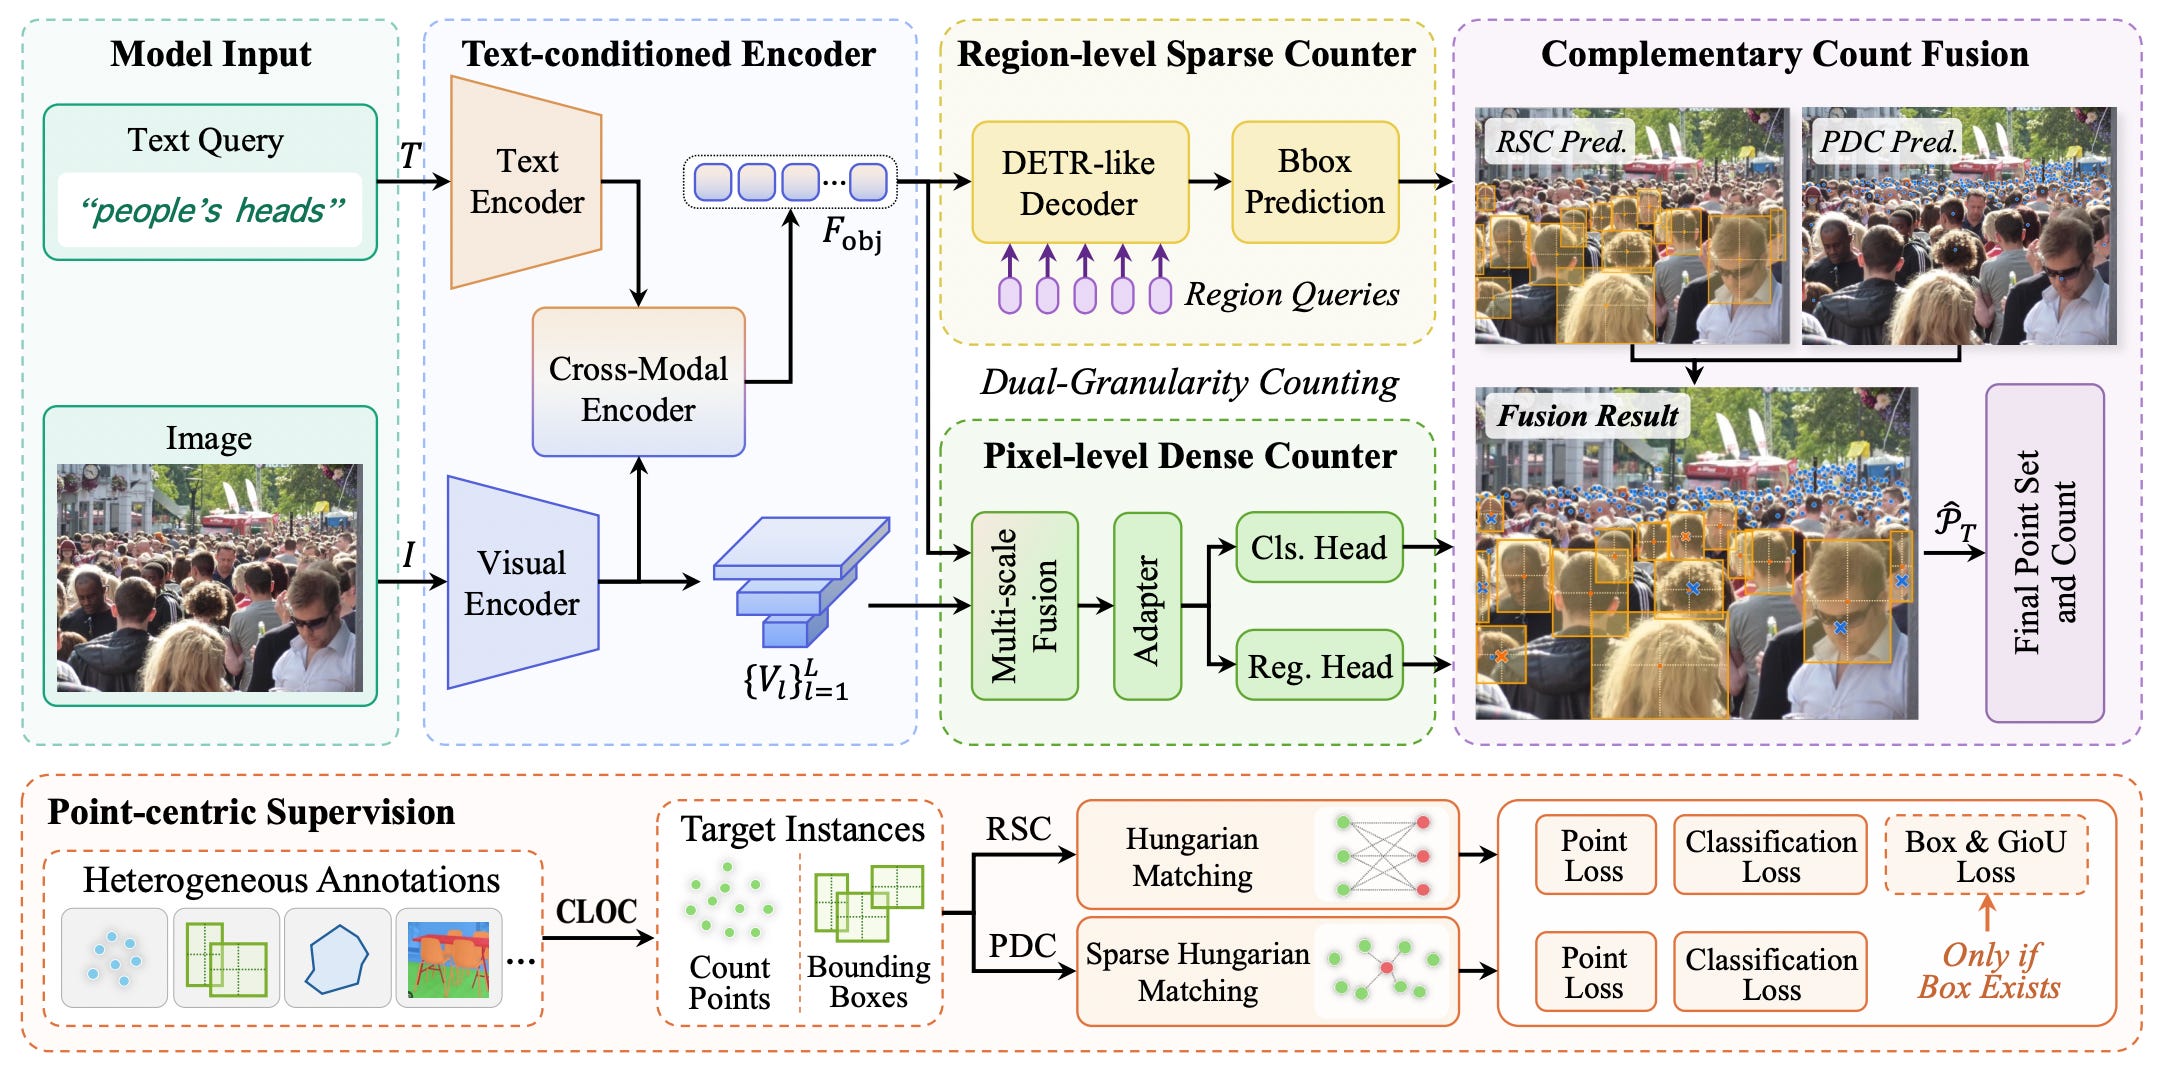
The Cross-domain Large-scale Object Counting (CLOC) dataset is a text-guided object counting collection designed to evaluate generalist vision models across diverse imaging conditions and density distributions. It unifies multi-source heterogeneous annotations from public repositories into a standardized category-specified format, containing approximately 220,000 images, 619 categories, and 15 million instance point annotations. You can check out the project page here and the code here.
4. Earthquake high-frequency magnitude catalogue
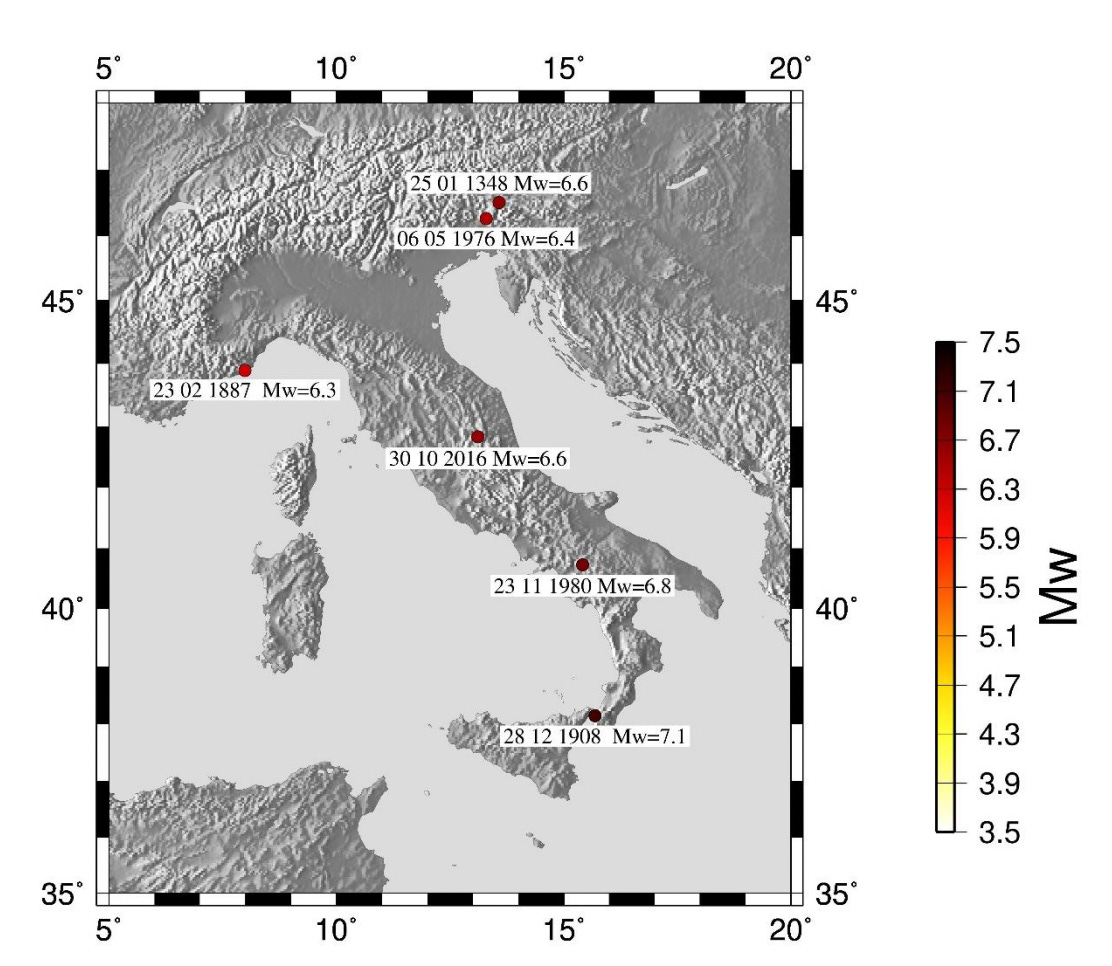
The Italian Catalog of Earthquakes based on the high-frequency earthquake Magnitude m3Hz (ICEM) provides high-frequency magnitude records for 1,951 historical and recent Italian earthquakes spanning from 1117 to 2020. You can access the data here.
Other useful bits
Google Earth has introduced new artificial intelligence-powered data layers that extract infrastructure assets like fire hydrants and storm drains directly from Street View imagery. Available for Professional and Professional Advanced users on web and Android, these layers combine with updated building footprints and land parcels to allow remote inspection of utility access and site constraints.
An open-source tool called SplatAnalyzer utilises cloud inference to convert 3D Gaussian splats into structured data by generating 3D bounding boxes and object labels in under a minute. Designed for applications in VFX, gaming, digital twins, and physical AI, the interactive kit allows users to isolate, highlight, and manipulate specific assets within a scene without needing local compute.
The Environmental Defenders Office has launched an interactive map on World Oceans Day to help the Australian public track offshore fossil fuel expansion in their waters. The tool outlines the environmental risks of deep-sea drilling and seismic blasting to marine biodiversity, while providing users with information on how to exercise their legal rights in environmental decision-making.
Jobs
SEI is looking for a Mid–senior Researcher in data systems and digital governance based in Stockholm.
EIB is looking for a Data Warehouse Officer based in Luxembourg.
PAHO is looking for a remote GIS and Information Products Consultant.
Vizzuality is looking for a remote Software Engineer based in either Spain, Portugal or UK.
GiveDirectly is looking for a Remote Sensing Analyst based in New York.
Just for Fun
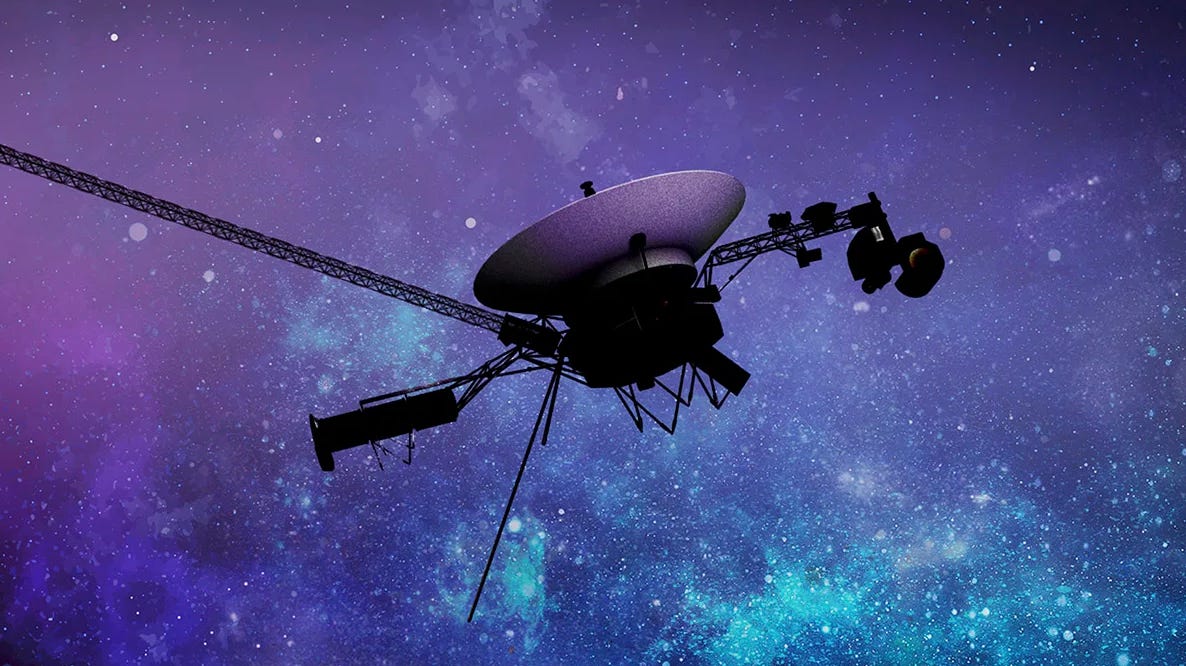
Hold on to your horses, NASA’s Voyager 1 will cross the 1 Light-Day threshold on November 18, 2026. That’s about 16 billion miles from Earth. If you use marathons as your unit of measurement, that’s like 610 million marathons.
That’s it for this week.
I’m always keen to hear from you, so please let me know if you have:
new geospatial datasets
newly published papers
geospatial job opportunities
and I’ll do my best to showcase them here.
Yohan