

🌐 A better way of thinking about urban sprawl
PLUS: Teaching AI about satellite images, how to actually use embeddings, and more.

Hey guys, here’s this week’s edition of the Spatial Edge — your weekly map to the latest geospatial news. In any case, the aim is to make you a better geospatial data scientist in less than five minutes a week.
In today’s newsletter:
Urban Physics: PDEs model city sprawl dynamics
Map Training: OpenStreetMap improves satellite AI captions
EO Embeddings: Blueprint for stronger geospatial representations
City Graphs: New Python library for urban networks
Aerosol Forecasts: AI delivers rapid global predictions
Research you should know about
1. Why do cities sprawl? The physics of urban growth
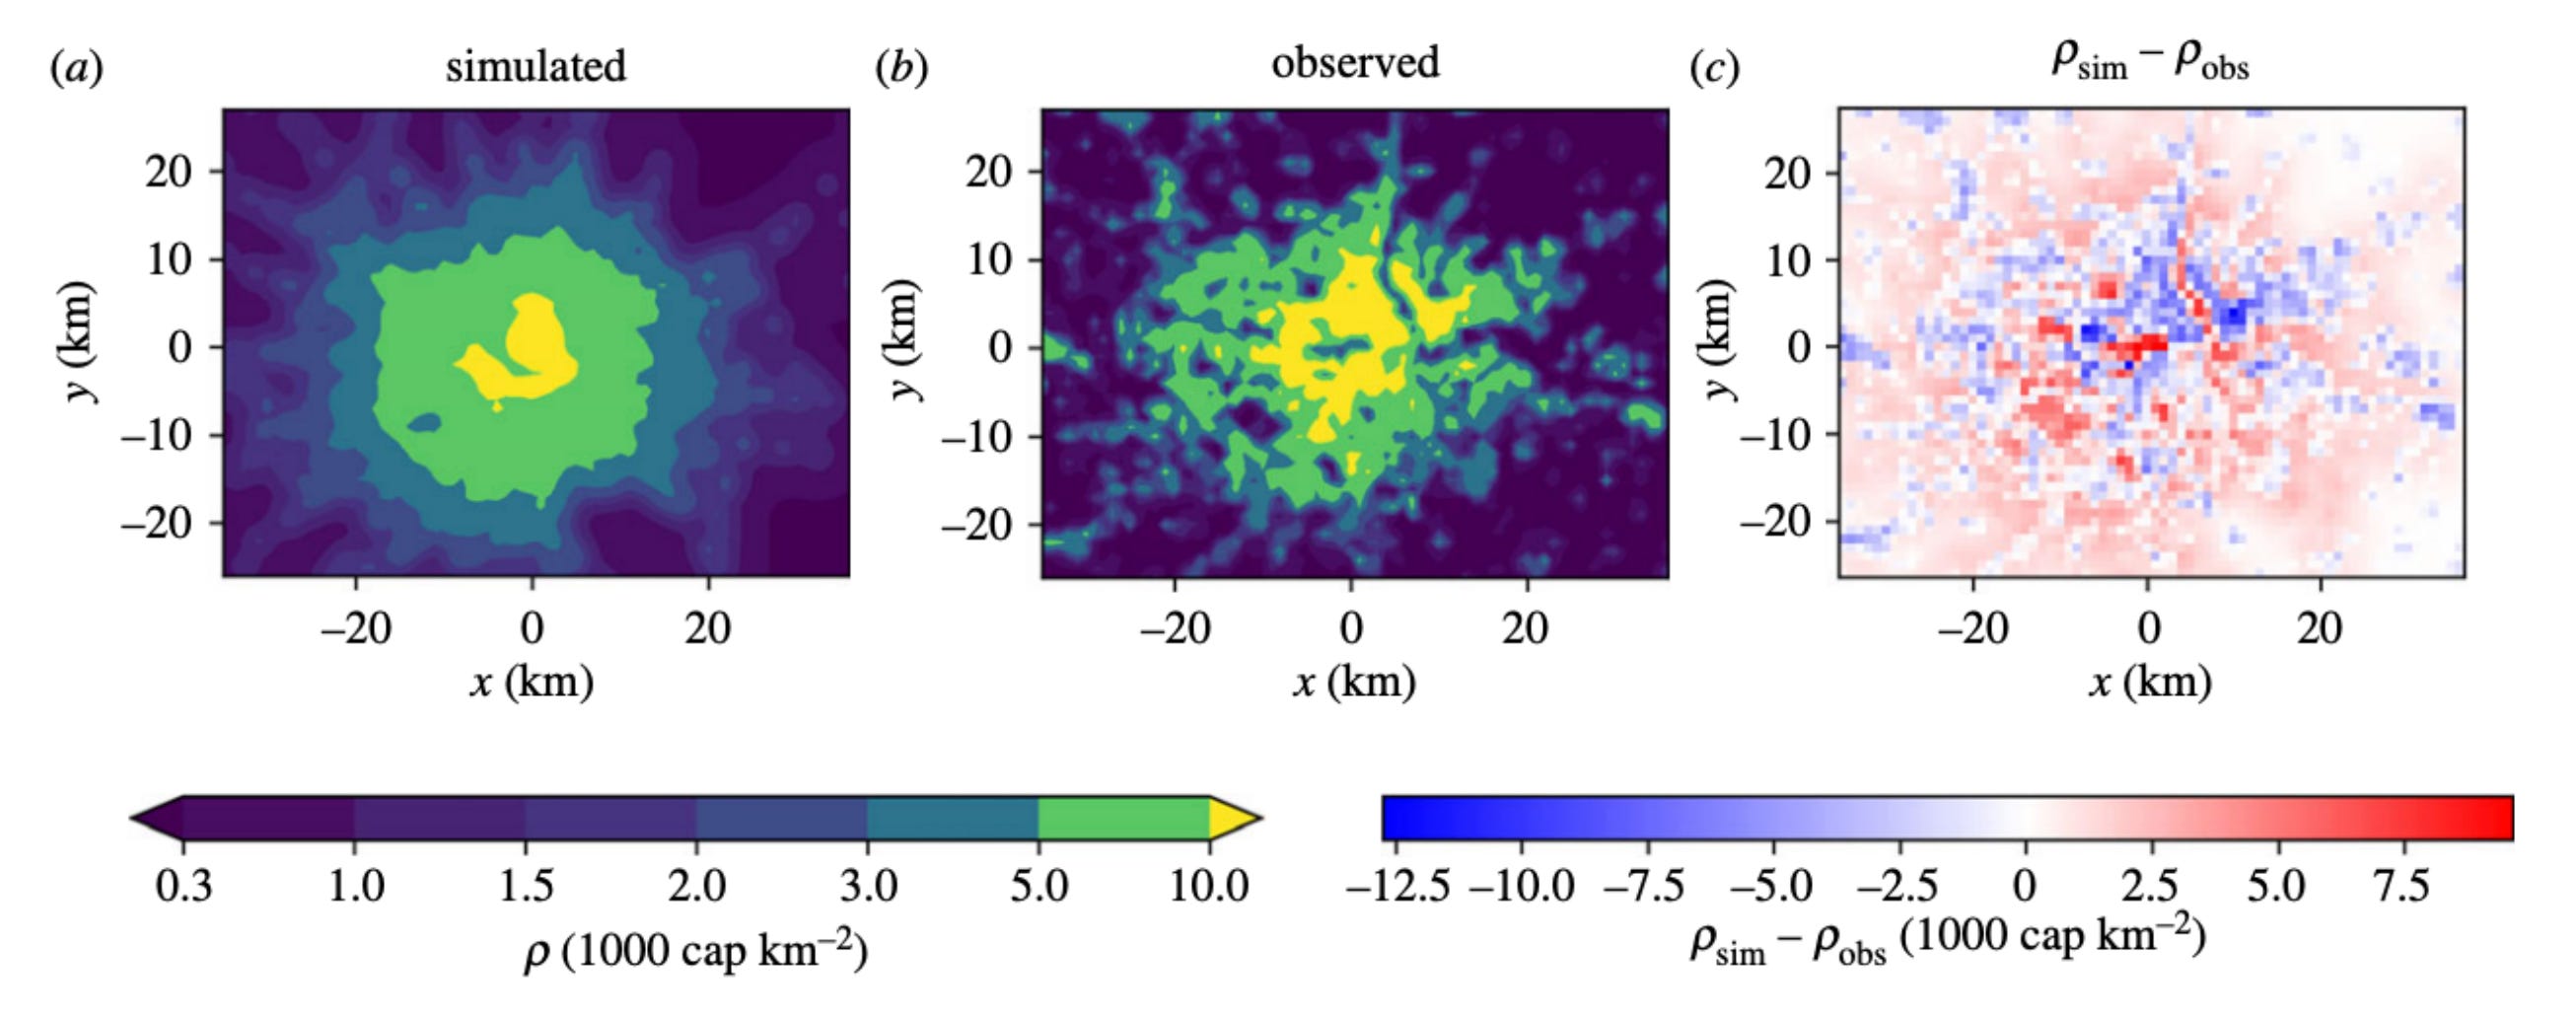
Between 1985 and 2015, the total amount of land covered by cities doubled, eating into green spaces, worsening air quality and making infrastructure incredibly expensive to run. Despite this massive transformation, actually explaining how and why cities expand the way they do is pretty difficult. Traditional urban economics often uses models that treat cities as if they are in a state of perfect balance, assuming that land is instantly redeveloped to its optimal use like a neat, circular dartboard. The reality is that cities grow in messy, uneven and unpredictable ways, driven by everything from traffic congestion to developer whims.
A new study argues that we should look at cities not through the lens of traditional economics, but through the physics of ‘surface growth’. In the same way that physicists use Partial Differential Equations (PDEs) to model the jagged edges of a growing bacterial colony or the spread of a tumour, these same mathematical tools can be used to model the irregular, sprawling boundaries of a city. Unlike older economic models, PDEs can handle the chaotic, real-world feedbacks of urban growth, such as how the construction of a new railway line suddenly makes a distant suburb boom, which in turn demands even more roads.
Recent studies have shown that this isn’t just an abstract theory. When researchers applied these physics-based PDE models to historical data from London and Sydney, they successfully replicated the real-world shift from dense, packed city cores to sprawling commuter belts over the last 150 years. The models naturally captured the ‘angiogenic’ growth of the cities, where population density and transport networks feed off each other in a constant cycle. Ultimately, the researchers argue that by merging complexity science with satellite data, planners can finally get a mathematical grip on urban sprawl, allowing them to test the long-term impact of new infrastructure before pouring any concrete.
2. Using maps to teach AI about satellite imagery
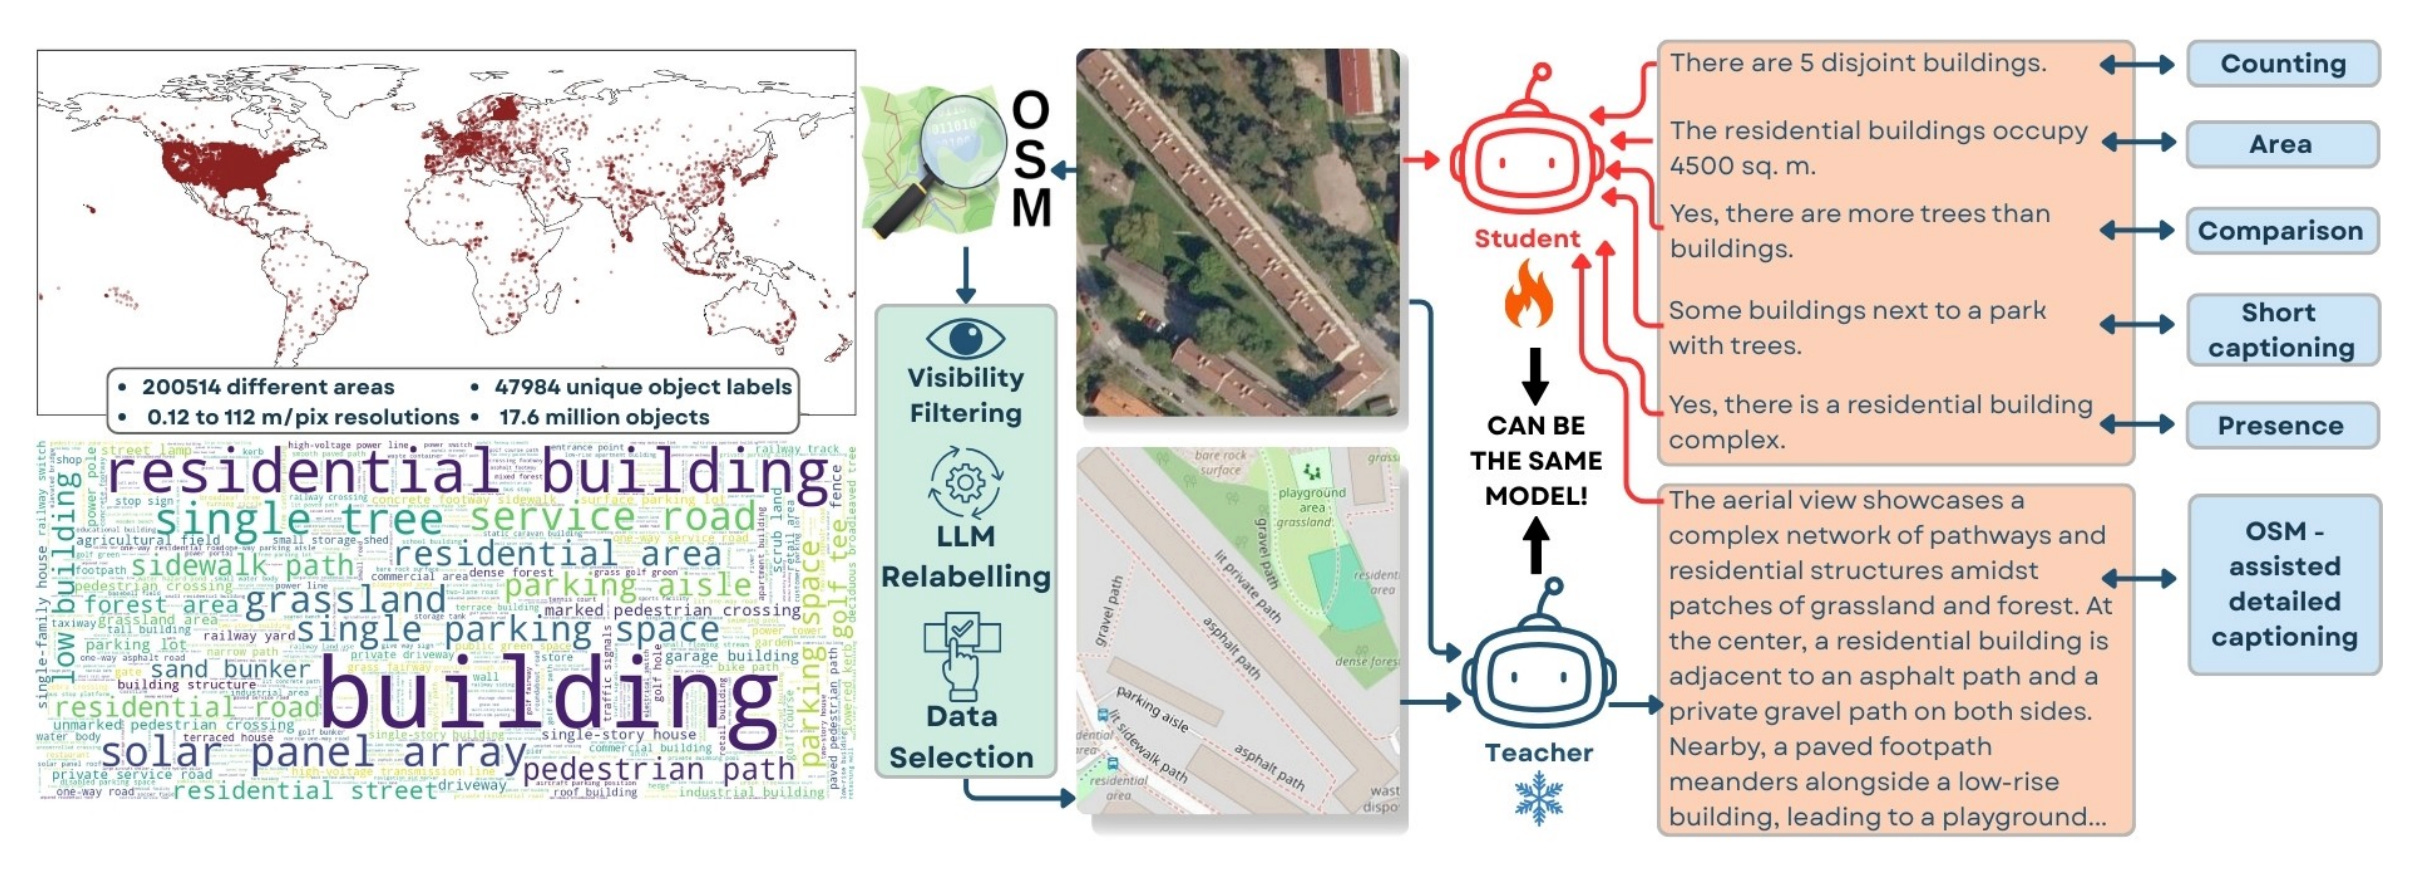
When it comes to processing satellite imagery, vision-language models (VLMs) have historically relied on a technique called ‘pseudo-labelling’ to learn about the Earth. Because high-quality, human-annotated satellite data is incredibly rare and expensive, developers usually rely on massive, general-purpose frontier models like GPT-5 or Gemini to act as a ‘teacher’. These teacher models look at satellite images and generate captions, which are then used to train a smaller ‘student’ model. However, this approach is both expensive and fundamentally flawed. The student model can never be smarter than its teacher, meaning it inherits all of the teacher’s mistakes and hallucinations.
Researchers have introduced OSMDA (OpenStreetMap-based Domain Adaptation) to break this reliance on expensive external teachers. The core idea is pretty simple: instead of asking a massive AI to guess what is in a satellite photo, the researchers pair the satellite image with a rendered map tile from OpenStreetMap. Because modern VLMs are already excellent at reading charts and OCR, the model can simply read the map to identify the roads, buildings and land-use polygons, and then cross-reference this with the satellite image to write a highly accurate, geographically grounded caption. This allows a capable base model to act as its own annotation engine.
Using this self-contained pipeline, the team generated OSMDA-Captions, a massive dataset of over 200,000 highly detailed image-caption pairs, entirely for free. When they mixed this new dataset with existing remote sensing data to train their OSMDA-VLM model, it achieved state-of-the-art results across the majority of ten rigorous benchmarks. It completely outperformed models that were trained using expensive frontier teachers, proving that leveraging crowdsourced geographic data is a far more scalable and accurate way to adapt AI to the remote sensing domain.
3. The blueprint for EO embeddings
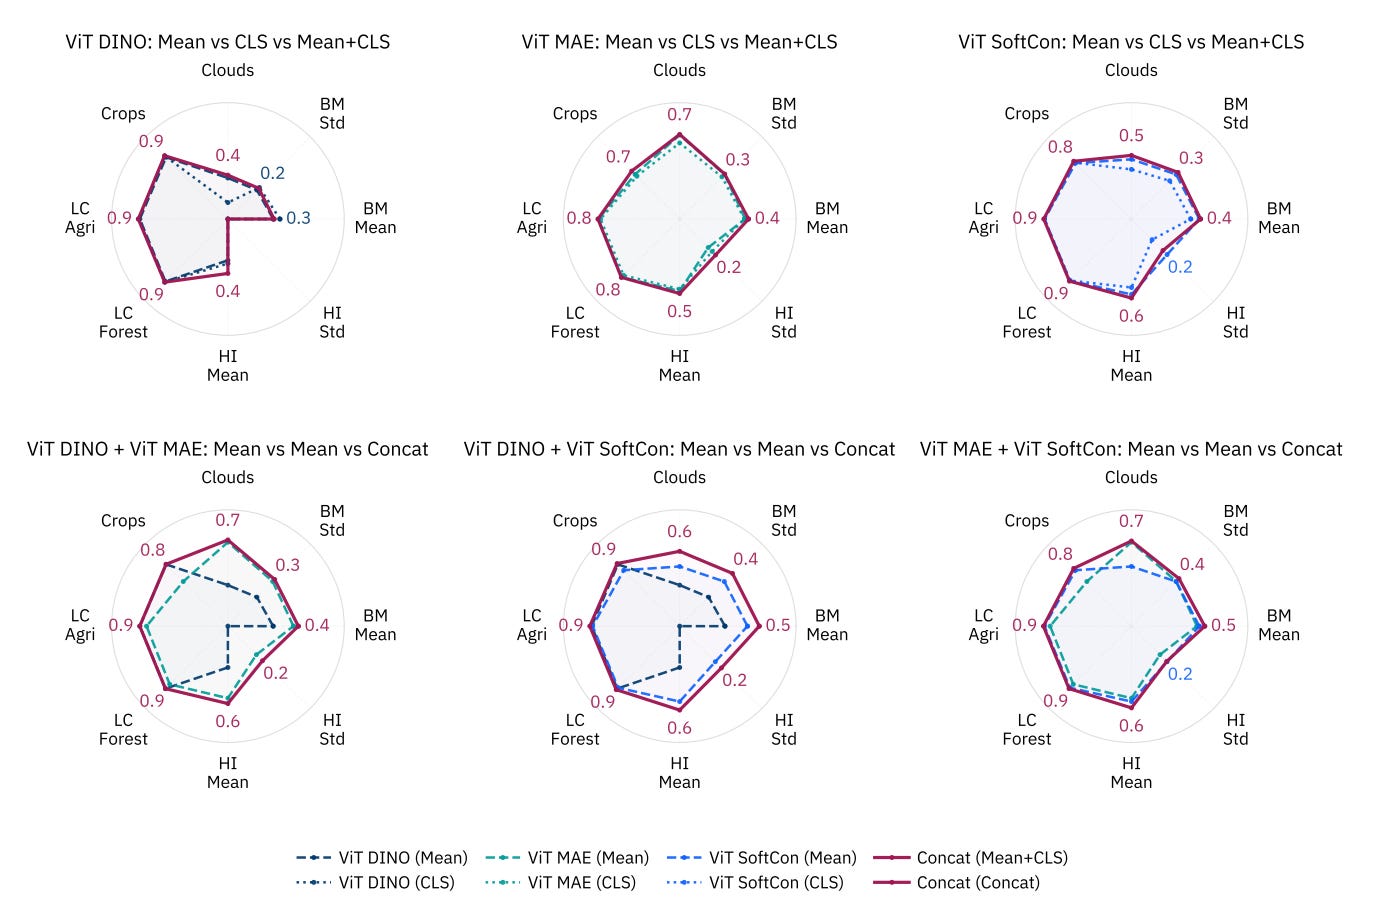
Earth observation satellites generate massive amounts of data every day. To make analyzing this imagery more efficient, developers use Geospatial Foundation Models to compress raw satellite images into compact mathematical representations called embeddings. This is something I’ve covered previously here. By reusing these embeddings, pipelines can run much faster without constantly reprocessing the raw images. However, the best way to extract and design these embeddings (e.g. choosing the right model architecture, the best layers, or the optimal pooling method) has remained unclear, which can lead to suboptimal performance in real-world applications.
A recent study introduces a systematic blueprint for designing these embeddings by rigorously evaluating various GeoFM configurations using the NeuCo-Bench framework. The research team tested how different architectural decisions, pretraining strategies, and data aggregation methods impact the AI’s ability to track diverse environmental factors, from crop coverage to biomass and urban heat islands.
The findings offer some useful guidelines for developers. The study shows that Vision Transformers consistently produce stronger, more versatile embeddings than Convolutional Neural Networks (CNNs) for these tasks. When compressing the spatial data, simple “mean pooling” (basically averaging out the features) proved to be the best strategy across the board (simple is best as they say…). Interestingly, the researchers discovered that pulling data from the final layer of a CNN often degrades accuracy for tracking continuous physical variables, meaning developers should extract data from intermediate layers instead. Finally, the study highlights that stitching together embeddings from models trained with different self-supervised learning objectives creates highly robust representations, effectively compressing satellite data by a factor of 500 while maintaining exceptional predictive power.
Geospatial Datasets
1. Cactus ecological and evolutionary dataset

CactEcoDB brings together spatial, environmental, trait, and phylogenetic data for over 1,000 cactus species. It combines occurrence records with a time-calibrated phylogeny, making it useful for studying biodiversity patterns, species evolution, and conservation risks. You can access the data here and the code here.
2. Pore-scale CO2-water interaction dataset
![Literature Review] Benchmark Dataset for Pore-Scale CO2-Water Interaction](https://substackcdn.com/image/fetch/$s_!AMTE!,w_1456,c_limit,f_webp,q_auto:good,fl_progressive:steep/https%3A%2F%2Fsubstack-post-media.s3.amazonaws.com%2Fpublic%2Fimages%2Ff322afa3-1c21-4330-a06b-85c6c3a52f98_1362x815.bin "Literature Review] Benchmark Dataset for Pore-Scale CO2-Water Interaction")
This new dataset captures how CO2 and water interact within porous media at the pore scale, with relevance for geoscience and carbon capture and storage. It includes 624 high-resolution 2D samples across 100 time steps under a constant injection rate, generated using numerical simulations. You can access the files here and the code here.
3. High-precision landslide event dataset

This dataset maps 1,582 landslide events across mainland China between 2008 and 2024. It uses LLMs to extract information from local news reports, capturing detailed timing and location data, often at village level. You can access the data here and the code here.
4. Forest disturbance deep learning dataset

The Deep4Dist dataset provides around 17,500 high-resolution image patches (0.2 m) from Rhineland-Palatinate, Germany. It combines RGB, near-infrared, and height data, with segmentation labels for disturbance types such as bark beetle damage, clear cuts, and windthrow. Access the data here and the code here.
Other useful bits
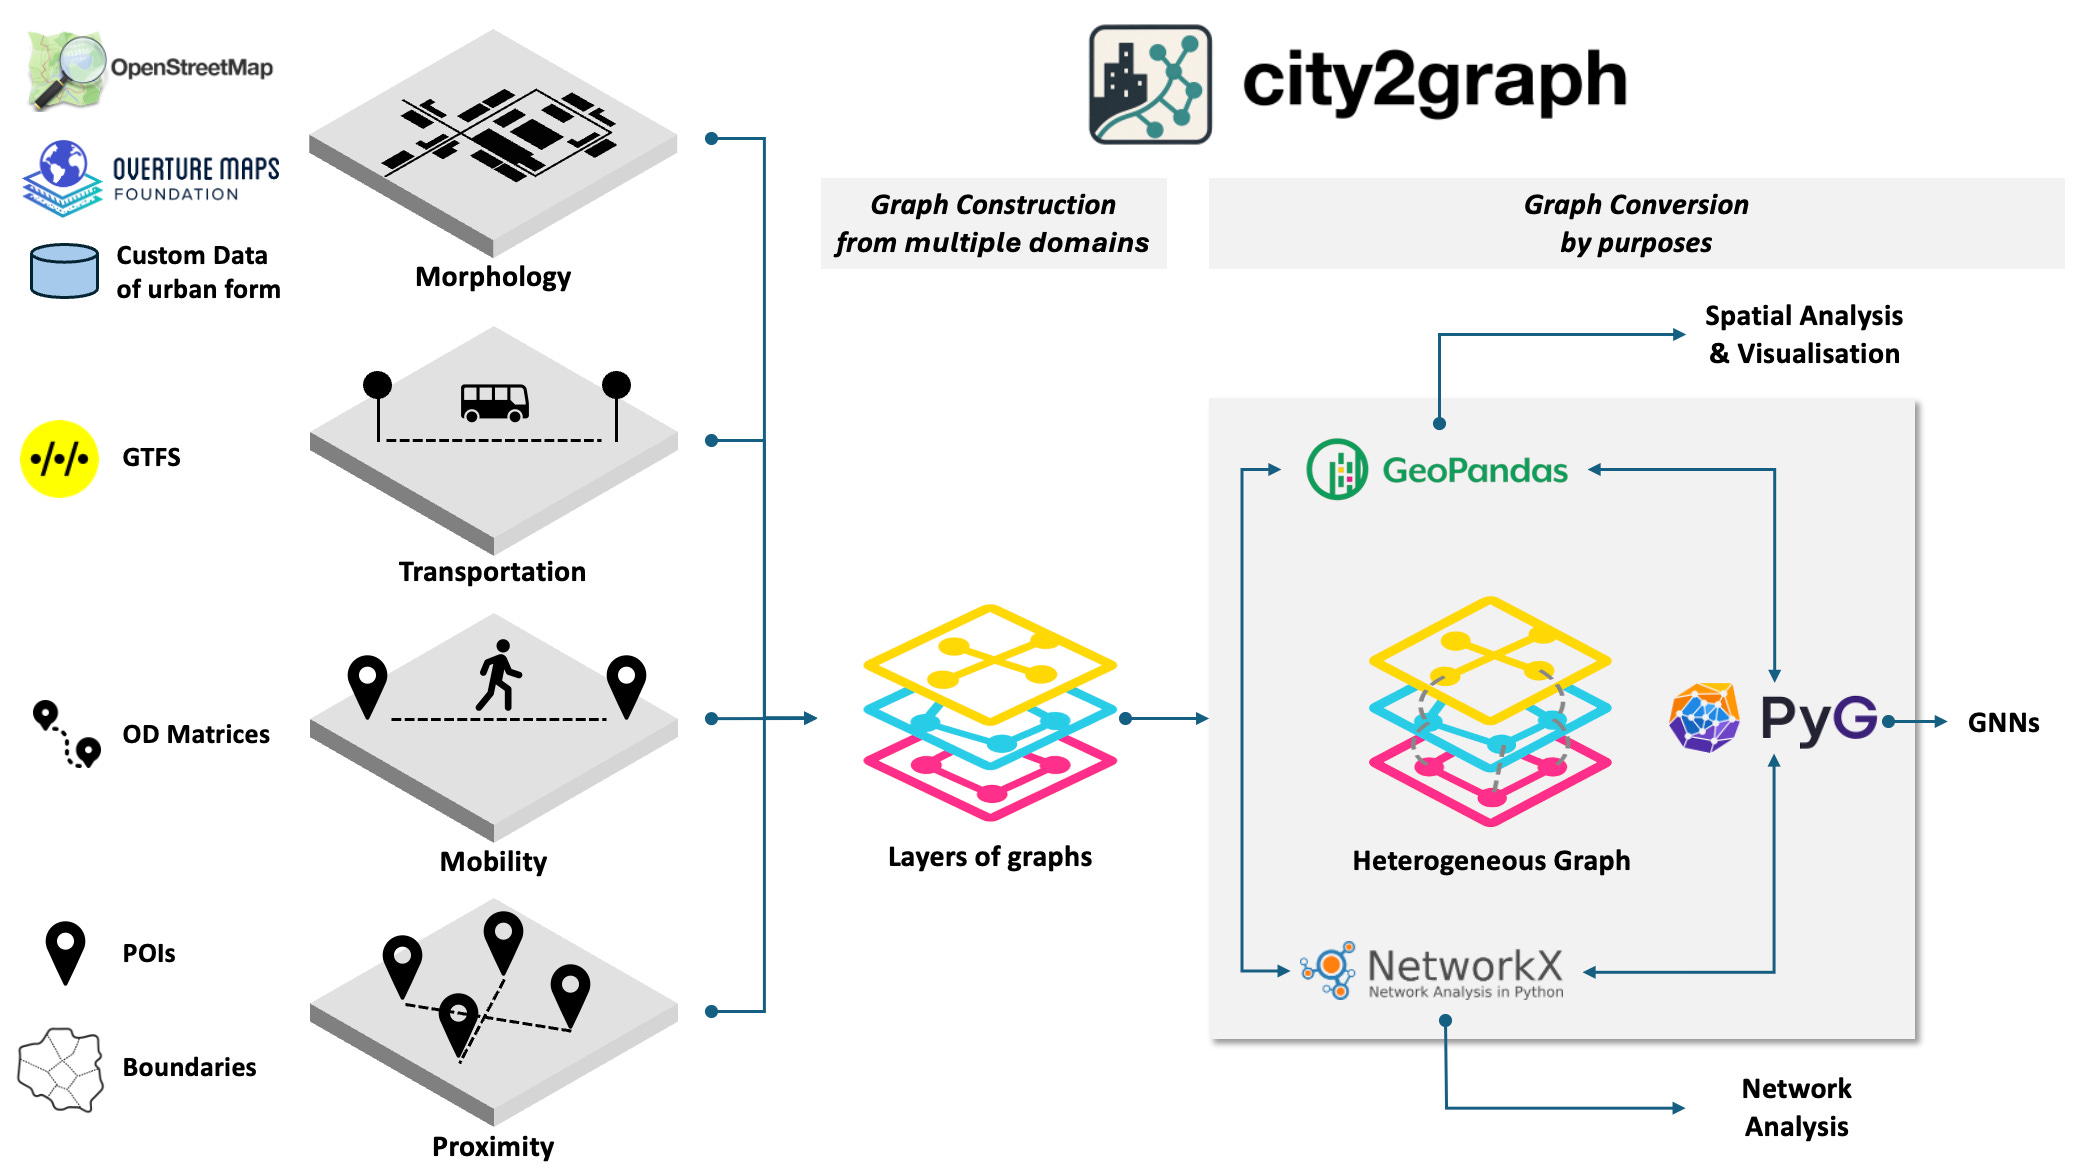
A new Python library called City2Graph has just launched, allowing developers to transform complex urban datasets into seamless graph representations. It’s a pretty useful resource for anyone looking to build advanced spatial network analyses or power innovative artificial intelligence applications using city mobility and infrastructure data.
The Planet and NVIDIA are teaming up to build a new AI-powered engine that processes planetary satellite imagery in seconds rather than hours. The system uses high-performance computing to generate higher-resolution outputs and enables a searchable, near real-time view of the Earth. This improves access to up-to-date geospatial data for monitoring and analysis.
SpaceX has exceeded 10,000 active Starlink satellites in low Earth orbit following a double launch. This marks a significant expansion of its global broadband network, increasing coverage and capacity across regions.
Researchers in China have introduced an AI-based system for global aerosol and weather forecasting. Trained on over 40 years of data, it produces detailed five-day forecasts in under a minute. The model supports faster environmental monitoring and improved understanding of atmospheric conditions.
Jobs
UN DESA is looking for two interns in (1) Geodesy & Geospatial Research Support and (2) Digital Design, Data Visualization & Geospatial Communications.
UNOPS is looking for an ICT Associate based in Valencia.
Esri is looking for a remote GIS Project Manager under their Assessment Department based in Canada.
Stantec is looking for a GIS Analyst under their Energy and Resources budiness unit based in Toronto.
Just for Fun
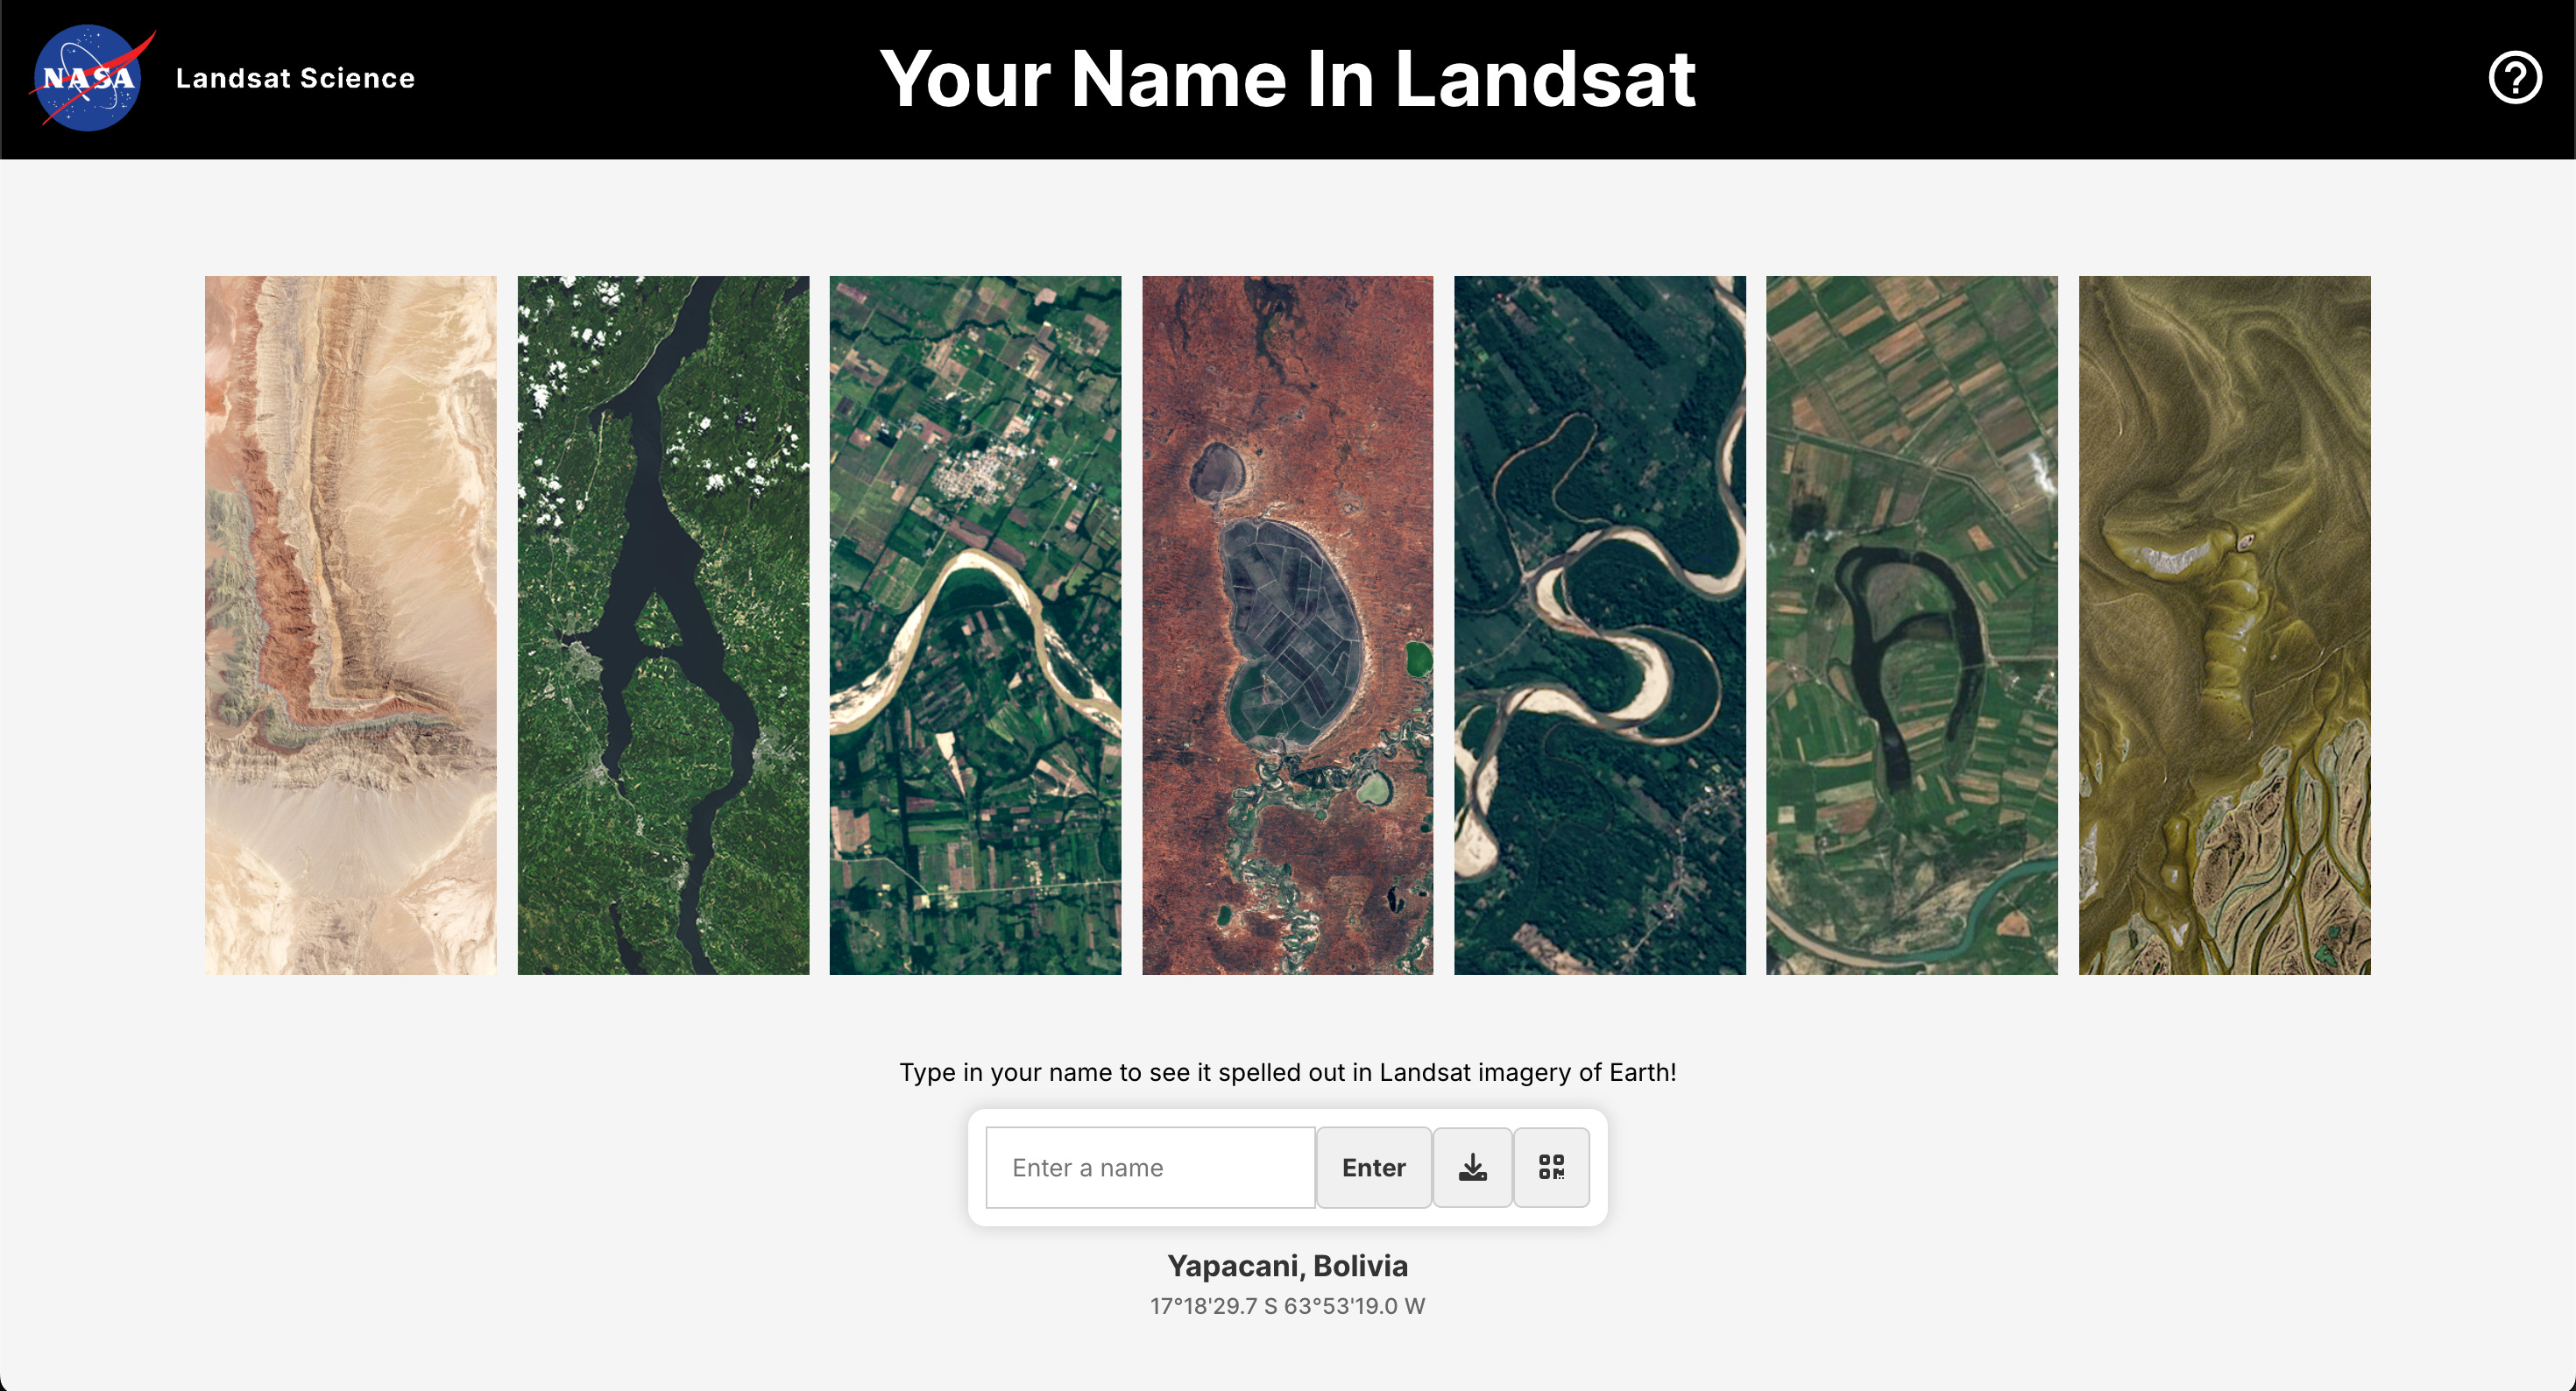
In celebration of Earth Day, NASA has released a cool interactive tool that spells out any name using natural geographic features captured by Landsat satellites.
That’s it for this week.
I’m always keen to hear from you, so please let me know if you have:
new geospatial datasets
newly published papers
geospatial job opportunities
and I’ll do my best to showcase them here.
Yohan