

🌐 Google DeepMind's new geospatial model explained intuitively
PLUS: New geospatial platforms from the UN, measuring the impact of pollution from cooking, and more.

Hey guys, here’s this week’s edition of the Spatial Edge.
If you’re big into the geospatial space, then last week may have got you tingling in your loins: Google DeepMind dropped a truly massive innovation. And I’m going to break it down for you in intuitive terms.
Onwards.
Research you should know about
1. Google DeepMind’s AlphaEarth Foundations

Last week, Google DeepMind dropped what could be one of the most important models in the geospatial data science space.
It’s called AlphaEarth Foundations. This is yet another addition to the geospatial foundation model family (I’ve covered these quite a lot before on this blog, but check this post out if you’re curious).
I want to break this all down for you in intuitive terms, so you can come away with an understanding of what AlphaEarth is, and why it’s kind of a big deal.
The big problem in Earth Observation
Earth observation (EO) data is vast. We have petabytes of satellite images, but it’s tough to efficiently use these to generate insights (e.g. How has this image changed over time? What kind of crop is here? What tree species?), particularly in data-poor parts of the world.
Traditional approaches rely on:
Hand-crafted features (like NDVI or composites)
Or machine learning models trained on specific tasks (but they often don’t generalise well, especially when labelled data is sparse).
How AlphaEarth Foundations addresses this
AlphaEarth Foundations (AEF) is a foundation model for geospatial tasks. It learns a universal representation of Earth’s surface by embedding geospatial data into a continuous “feature space.” This means it converts raw EO inputs into rich, reusable vectors (or “embeddings”) that represent what’s happening at any location and time.
You can think of this as building a “Google Translate” for geospatial data: once trained, the model can take in sparse or patchy data and still “understand” the patterns of Earth’s surface well enough to generate useful maps.
A primer on embeddings
To understand embeddings, it probably helps to work through an example.
Imagine we have the following graph:
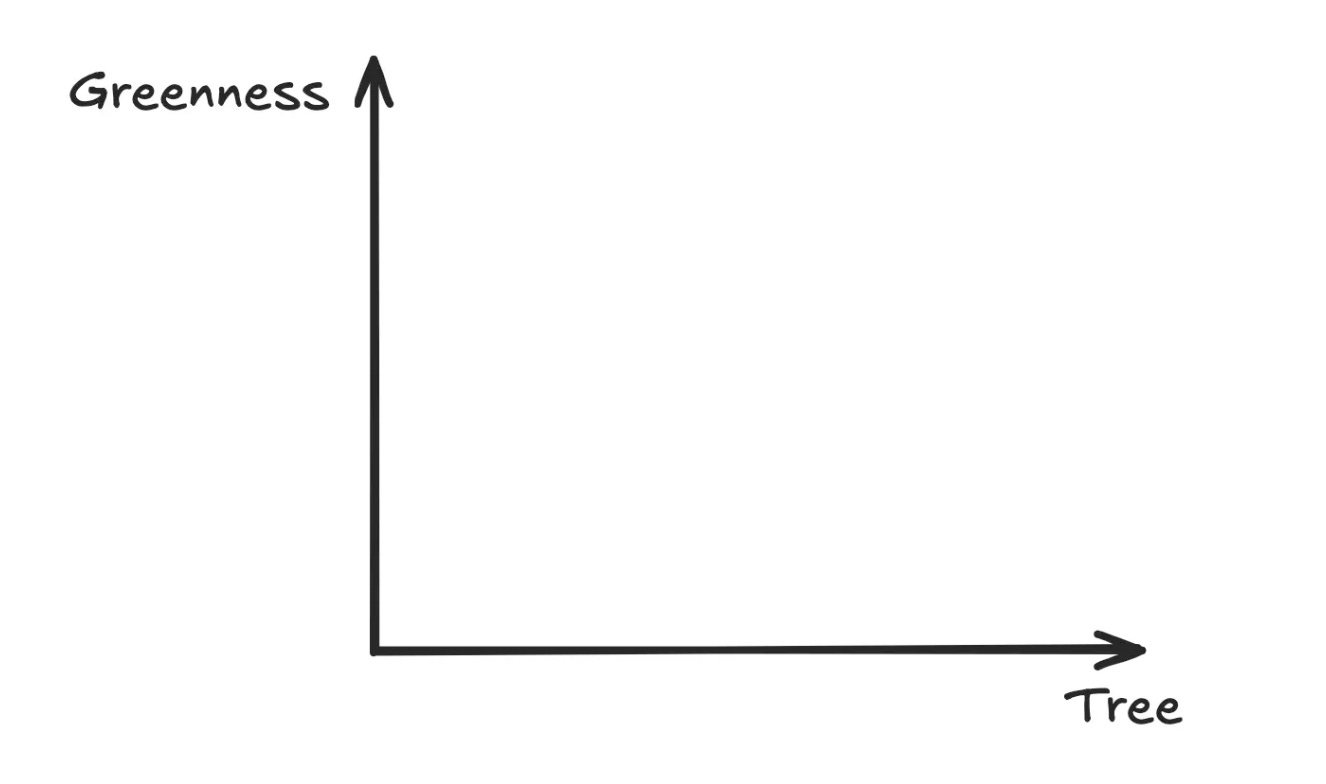
You can see that there are just two dimensions to this graph. A ‘greenness’ dimension and a ‘treeness’ dimension.
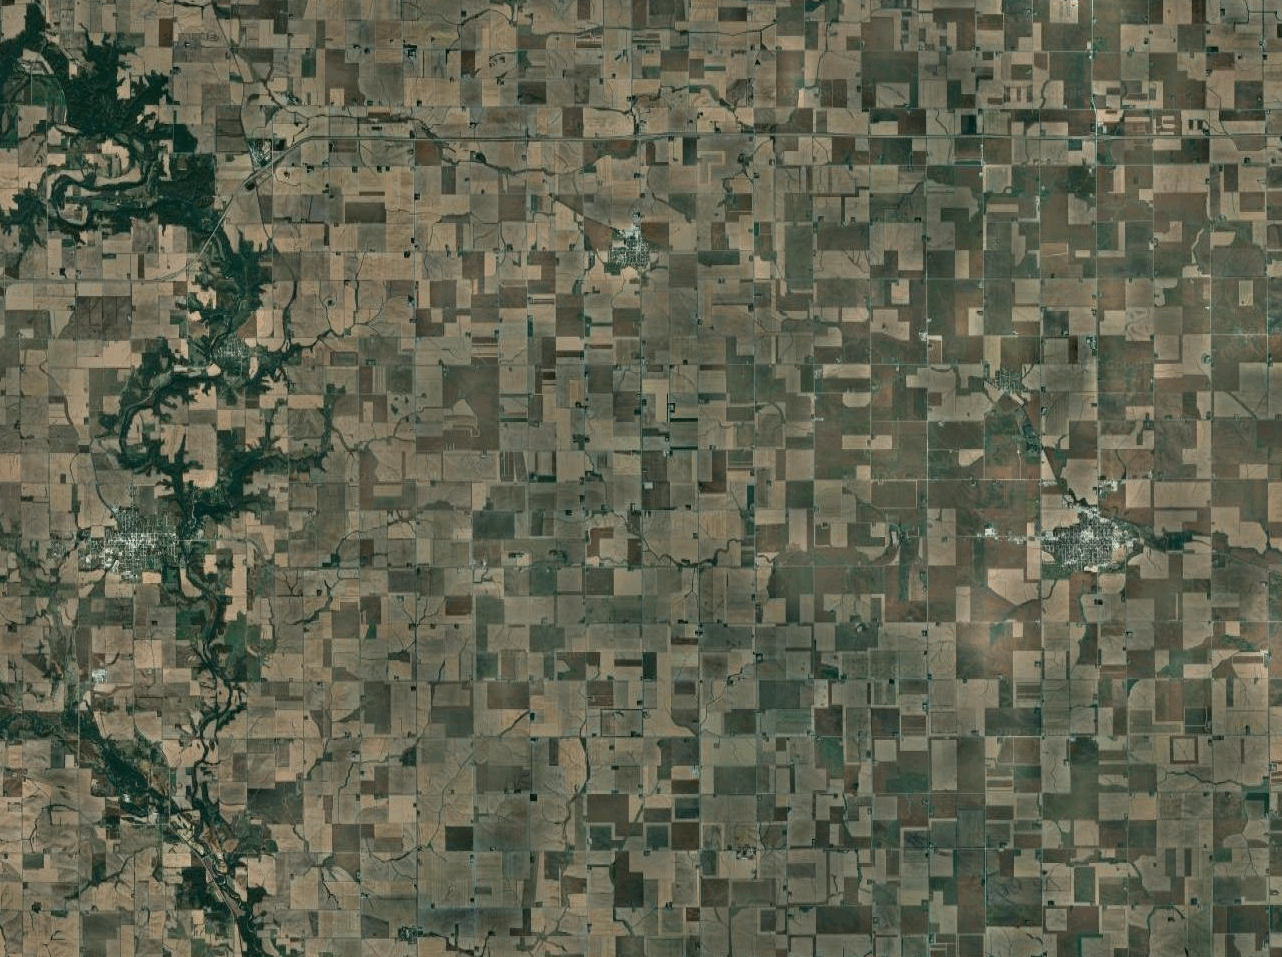
Now imagine if we take a satellite image and break it down into small grids, like the following. Let’s focus on one specific grid - i.e. the one I’ve selected in orange below:

If we took this orange grid, and situated it on our graph (or ‘embedding space’), it would probably sit somewhere here (since it’s both pretty green, and pretty tree-like):

Congratulations, if you’ve followed this basic example, you’ve got the idea of what an embedding is.
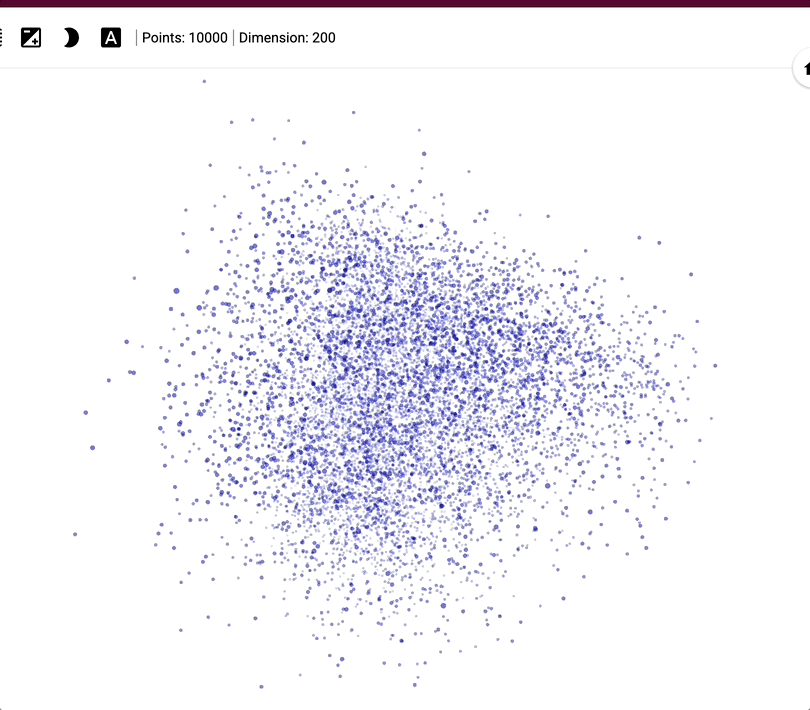
Now, imagine if instead of us just having two dimensions, we have dozens (e.g. it may cover anything from ‘blueness’ to ‘urbanness’ to ‘smokeyness’), etc.
And then, instead of us just having one grid from one satellite image, we situate every grid from billions of satellite images.
We’d end up with a LOT of embeddings. But an image of a tree in Indonesia would have ‘coordinates’ close by to an image of a tree in Brazil, since they’d be similar.
So basically, you can think of embeddings as a way to do two things:
Compress a large amount of information from images into a small set of numbers/coordinates, and
Position similar parts of an image close together in a multi-dimensional space, so that the model can understand relationships between them.
This might be hard to wrap your head around, so here’s a visual example that helps make it more concrete.
It shows how about 1,000 words (not images - I couldn’t find a good example with images) are represented using embeddings across 200 dimensions. In this space, the word “Albania” ends up near other related words like “Albanian” or “Angola”, because the model has learned that they often appear in similar contexts.
So what can we do with these embeddings?
In real-world mapping, you often have:
Some labels in some places (e.g. field plots)
Different sensor data at different times
Missing or noisy observations
AEF deals with this by using embeddings to interpolate across space, time, and data gaps. It doesn’t need a complete dataset. It essentially learns to “fill in the blanks” by using patterns it has already seen.
What makes AEF different
You might have seen me talk about a few different geospatial foundation models on here, like NASA and IBM’s Prithvi.
AEF is different from previous models because:
It uses more data sources (satellites, field measurements, climate records, etc.)
It includes time, not just static snapshots, but trends and changes (though Prithvi’s latest model does this).
It works at high resolution, down to 10m² (fine enough for farm fields, wetlands, or urban patches).
It generalises well: even when trained on sparse data, it outperforms other models on a wide variety of tasks.
It’s more efficient and more accurate: Each location’s representation is only 64 bytes, which is ~16x smaller than other compact learned models. Yet it reduces errors by ~24% compared to the next-best methods on average.
How does it work?
There are a few different techniques Google DeepMind uses to improve the accuracy of AEF, compared to other foundation models. I’d break it down into four things:
Temporal flexibility
It models continuous time, meaning it can interpolate (fill gaps) or extrapolate (predict beyond observed dates) using timestamped EO inputs. You don’t need perfect coverage. AEF learns from what’s available.
Space-Time Precision (STP) encoder
This encoder processes satellite inputs using:
Spatial attention (to detect local patterns like field shapes)
Temporal attention (to learn how areas change over time)
Convolutions (to preserve detail)
It operates across different scales and resolutions to model local patterns and global context efficiently.
Contrastive learning with text
AEF aligns geospatial data with geotagged text descriptions (including from Wikipedia), which helps it learn semantically meaningful representations. For example, if a location is tagged “soybean farm,” AEF can link the image data with that concept.
Uniform embedding distribution
The model ensures its embeddings are evenly spread in space (on a unit hypersphere) to avoid collapsing to similar values, which improves generalisation.
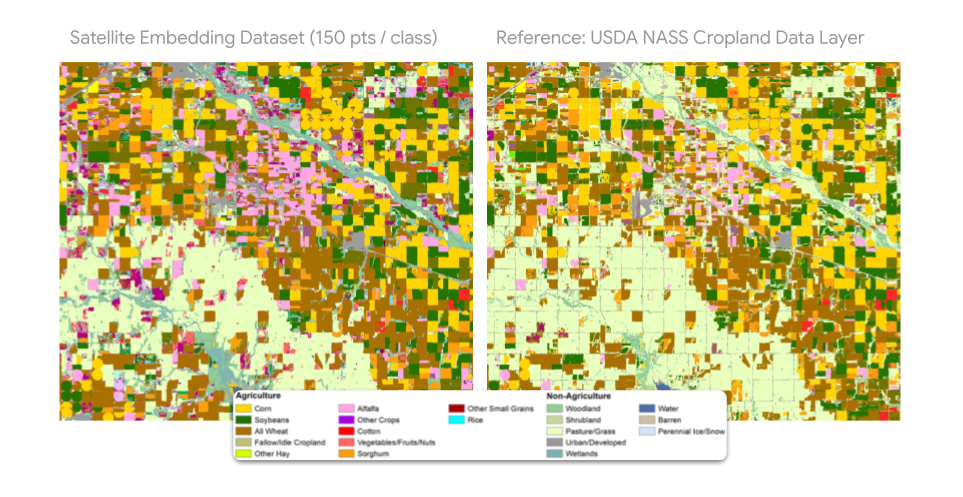
How well did it perform?
AEF was benchmarked on 15 evaluation tasks including:
Crop type mapping
Tree species classification
Evapotranspiration and emissivity estimation
Land use change detection
They compared AEF to:
Hand-crafted features (e.g. composites, harmonics)
Domain-specific learned models (e.g. SatCLIP, Prithvi)
Simple baselines (e.g. XY coordinates or pretrained Vision Transformers)
They found that AEF outperformed all others across the board. It particularly performed well in the following tasks: (1) “Max-trial” (realistic dataset sizes): ~24% error reduction, (2) “10-shot” (only 10 labelled samples/class): ~10% reduction, and (3) “1-shot”: ~4% reduction.
Interestingly, AEF seems to be able to estimate biophysical variables that are continuous rather than categorical. Two examples tested:
Evapotranspiration: The amount of water evaporated and transpired from land (important for agriculture, hydrology, and climate).
Emissivity: How much heat is radiated from Earth’s surface (important for energy balance and climate monitoring).
AEF significantly outperformed baselines here too, especially in evapotranspiration, where most models failed entirely. It was the only one with a meaningful predictive score (R² = 0.58).
How can we access it?
The other big drop from Google is that these embeddings are now available for free on Google Earth Engine. This makes it immediately easy to use and interact with through the GEE system, rather than having to download the embeddings/model weights from Hugging Face and load them on your own virtual machine (as is the case with other foundation models like Prithvi, Major Tom and Clay).
So the bottom line is that it’s a lot easier to use these embeddings, since most geospatial folks are already familiar with GEE.
What can we do with this?
Here are a few ideas on what can be done more easily using these embeddings, courtesy of Google.
Similarity Search
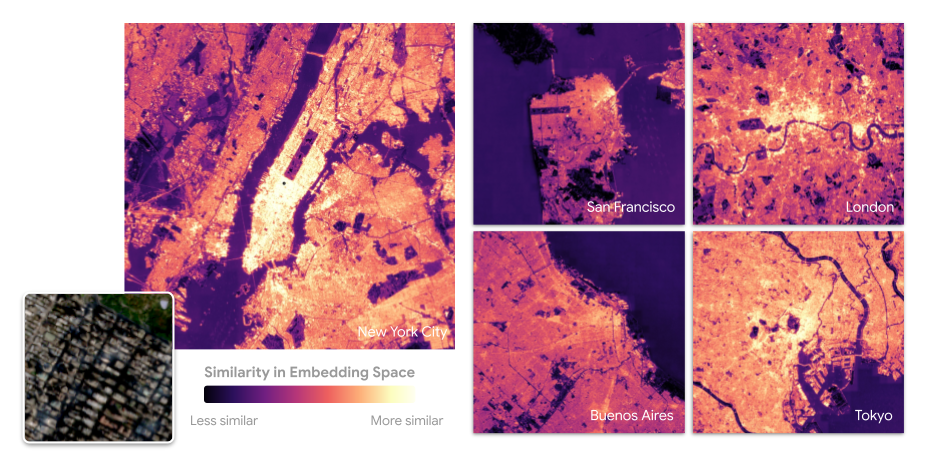

You can choose any location on Earth, like a patch of farmland or forest, and instantly find all other places with similar surface and environmental characteristics, no matter where they are.
Change Detection
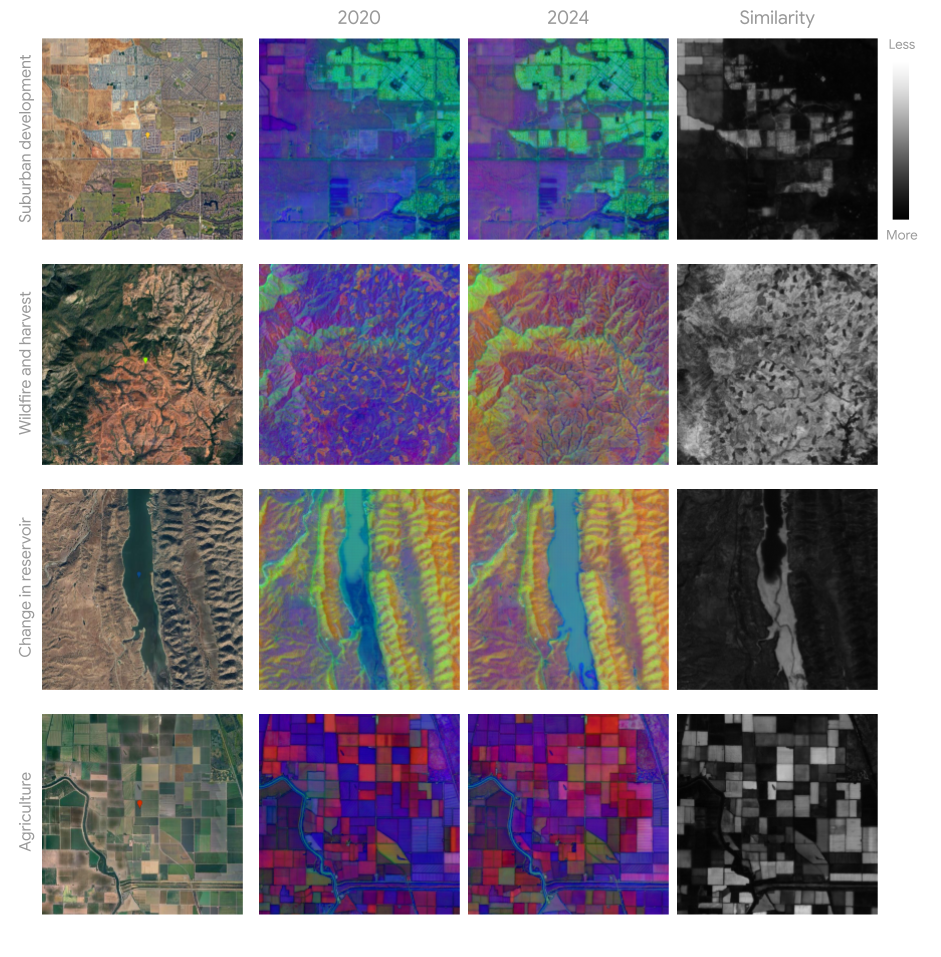

By comparing the embedding values for the same location across different years, you can easily detect changes. This lets you track things like urban growth, wildfire damage and recovery, or changes in water levels in lakes and reservoirs.
Automatic Clustering

Even without labels, you can use clustering methods to group similar pixels together. This kind of segmentation can uncover patterns in the landscape, such as different forest types, soil zones, or styles of urban development.
Classifying images with less data

You can train accurate maps using much less labelled data. For example, instead of needing tens of thousands of labelled crop points, you might only need a few hundred per crop type. This cuts down on both time and computing resources.
Get funding to test this out
Google is offering small grants of up to $5,000 to investigate use-cases for these embeddings. You can apply here.
Ok, so I hope you now get a sense of what AEF can do (and more generally what these foundation models aim to do).
If you’re interested in this topic, you can read more about some of the criticisms of (older) foundation models here:

Other useful bits
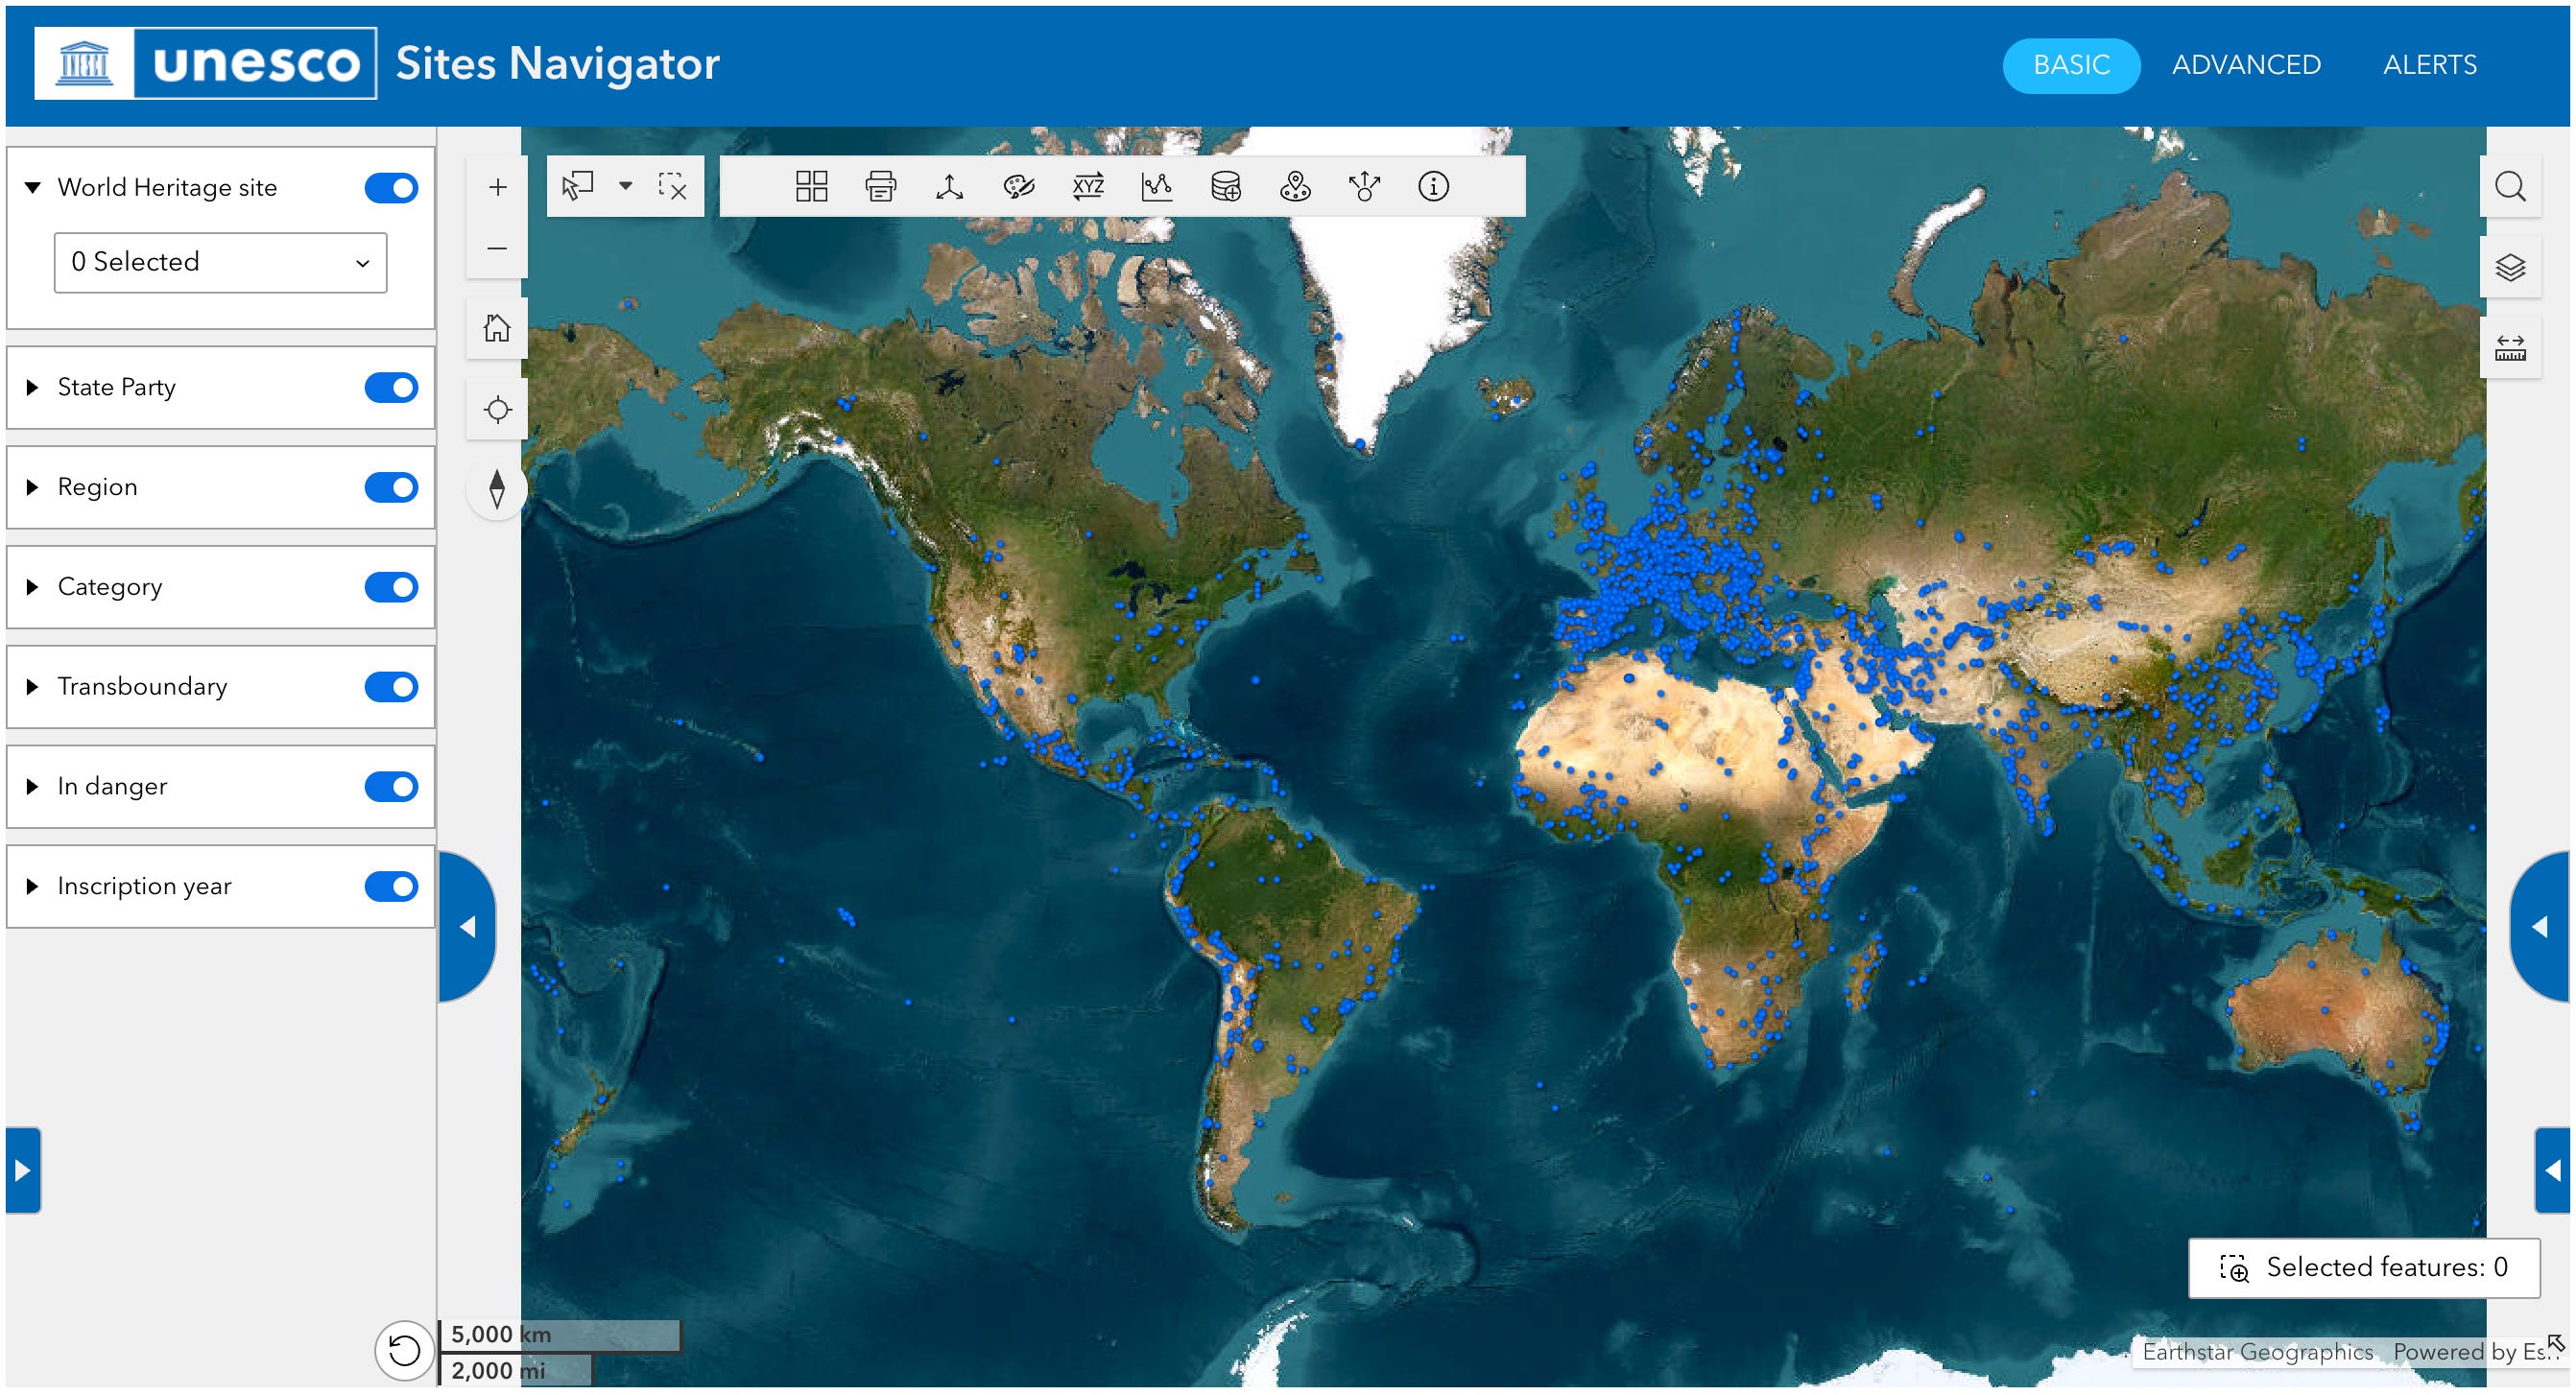
UNESCO’s new Sites Navigator brings together verified spatial data on World Heritage sites, Biosphere Reserves, and Global Geoparks in one public platform. It supports site monitoring with maps, remote sensing, and even hazard alerts based on near real-time satellite data. It can help track risks like wildfires or coral bleaching and is designed to guide smarter conservation decisions.
A new OECD-UNDP report makes the economic case for more ambitious climate plans (NDCs) in 2025. Strengthened NDCs could boost global GDP, lift 175 million people out of poverty, and reduce long-term climate risks.
The UN has launched a new Geospatial website with updated maps, earth observation examples, and web-mapping tools. More features and archives will be added over time.
The IEA’s latest report, Universal Access to Clean Cooking in Africa, shows that access is still worsening in sub-Saharan Africa, despite global progress. It tracks implementation of $2.2 billion in recent commitments and introduces a new scenario to help countries speed up progress. The analysis includes infrastructure mapping and fuel affordability assessments across the continent.
Jobs
The OECD and IEA are looking for a Data Visualization Designer based in Paris to work within the Energy Technology Policy (ETP) Division.
UNHCR is looking for a Senior Data Management Associate based in Toronto.
Mapbox is looking for a Software Development Engineer II based in the US.
Sylvera is looking for a Geospatial Data Scientist (Intern) based in London.
Development Seed is looking for a remote Geospatial & AI Tools Engineer based in an ESA member country.
Just for Fun

Dust storms affect both the environment and human health. This Copernicus Sentinel-3 satellite image from 15 July shows Saharan dust drifting over the Mediterranean, creating a hazy layer above the water.
That’s it for this week.
I’m always keen to hear from you, so please let me know if you have:
new geospatial datasets
newly published papers
geospatial job opportunities
and I’ll do my best to showcase them here.
Yohan