

🌐 Cracking open Google’s geospatial black box
PLUS: Building AI that works across different disaster zones and more.

Hey guys, here’s this week’s edition of the Spatial Edge — your weekly map to the latest geospatial news. This newsletter is a bit more like RGB than SAR - we’re impacted by the weather, but we’re tried and true. The aim is to help you become a better geospatial data scientist in less than 5 minutes a week.
In today’s newsletter:
AlphaEarth Insights: Embeddings reveal hidden land-cover structure.
Disaster AI: Domain adaptation improves damage detection.
Urban Planning: Deep learning unifies fragmented city data.
3D Remote Sensing: AI models finally learn elevation.
Crop Adaptation: Climate-responsive planting strategies simulated globally.
Research you should know about
1. Cracking open Google’s geospatial black box
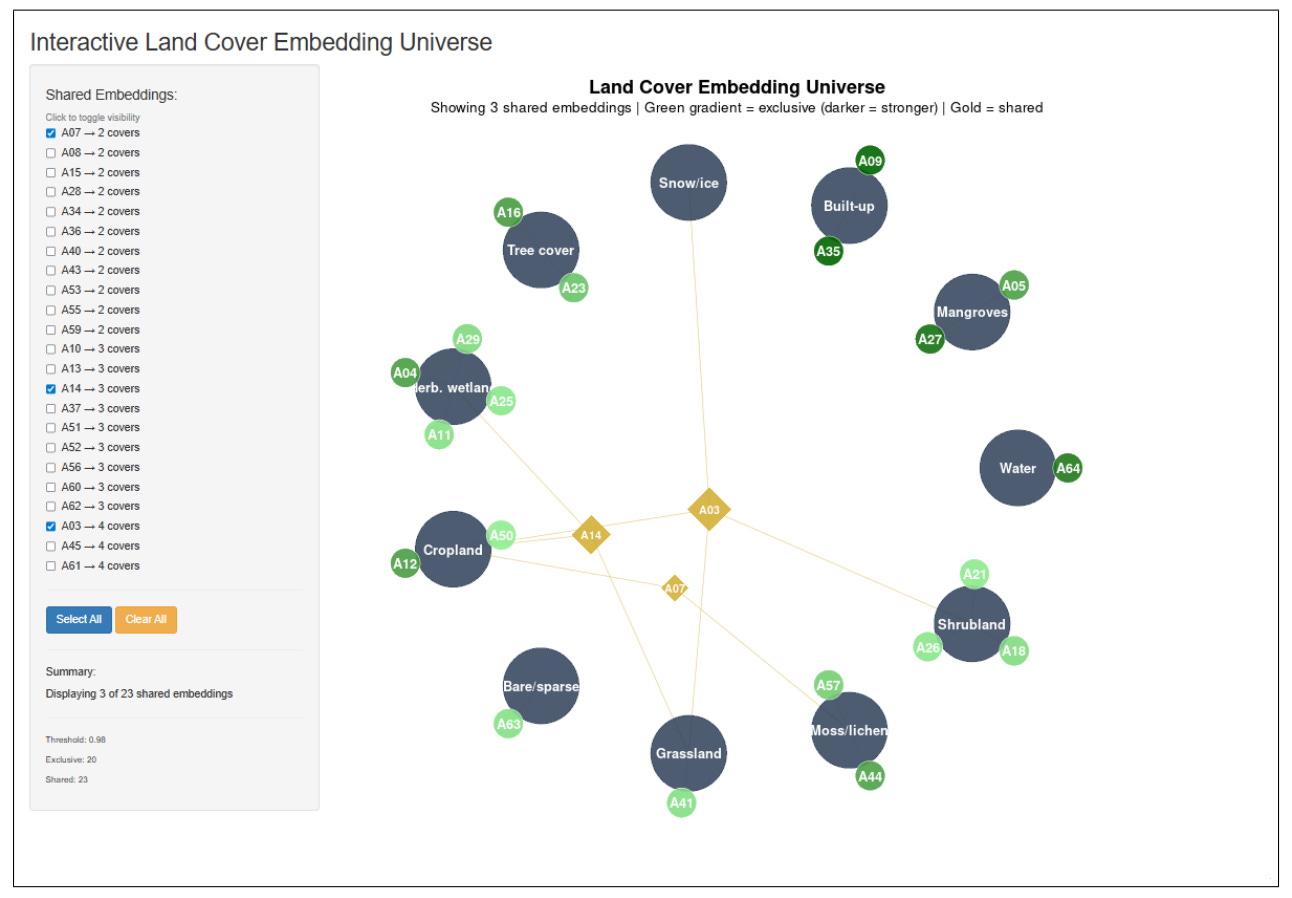
I’ve previously covered Google’s AlphaEarth a few times on here. In short, it’s one of the new geospatial foundation models trying to turn satellite and Earth observation data into reusable “embeddings”. In simple terms, these embeddings are compressed numerical descriptions of places on Earth. The tricky part is that these numbers are usually hard to interpret. A new paper tries to open that black box by asking what the individual embedding dimensions seem to capture when applied to land cover classification.
The main finding is that the embedding space appears to have a kind of internal geography. Some dimensions act like specialists, strongly linked to one land cover type, such as permanent water, built-up areas, grassland, bare soil, or moss and lichen. These make intuitive sense because certain land covers have very distinctive spectral or structural signatures. Water, for example, has very low reflectance in near-infrared and shortwave infrared bands, while bare soil and sparse vegetation have a very different year-round pattern.
The more interesting part is that other dimensions are shared across multiple land cover types. These seem to capture messy transition zones: cropland and grassland, shrubland and tree cover, bare soil and wetlands, or snow and sparse vegetation. That’s useful because real landscapes rarely fit neatly into clean categories. The paper’s bigger point is that geospatial foundation models may be learning both the “core” of land cover classes and the fuzzy spaces between them. If that holds up across more tasks and regions, it could make these models easier to prune, explain, and use for things like change detection, land degradation monitoring, and environmental planning.
Another pretty interesting finding is that the embeddings do a lot of unnecessary heavy lifting. Because the researchers mapped out exactly what each dimension does, they found that you simply do not need to use all 64 of them. Depending on the specific terrain you are looking at, you can hit 98% accuracy using just two to twelve targeted dimensions. This means developers can prune away the dead weight and slash their computing and storage costs by up to 90%, making it far cheaper to run high-resolution global models without losing any meaningful detail.
2. Building AI that works across different disaster zones
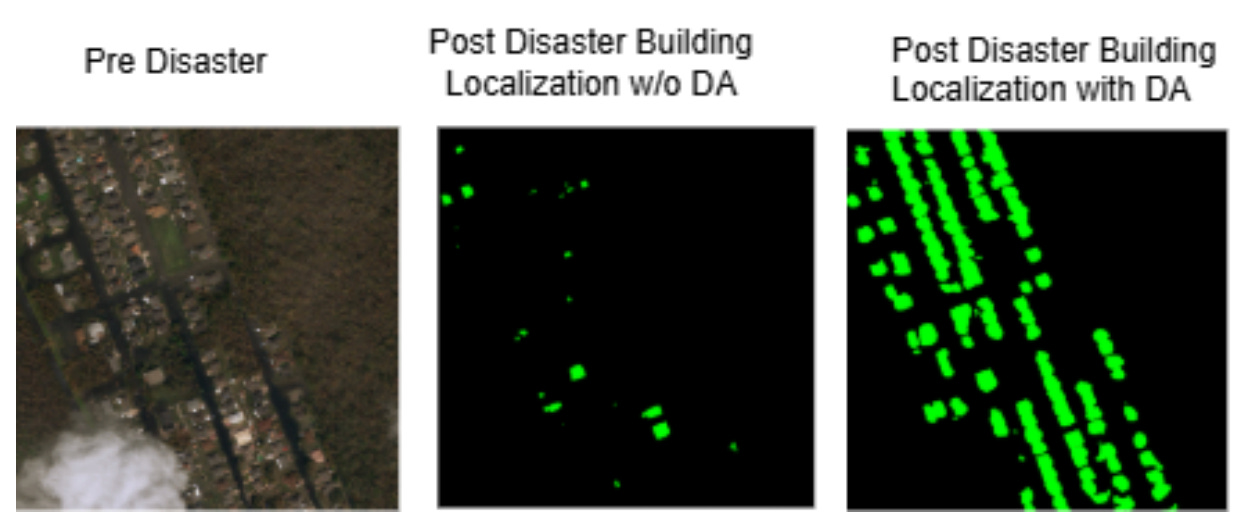
When a major disaster strikes, emergency responders increasingly rely on AI to rapidly scan satellite imagery and assess building damage. This allows human operators to stop squinting at fuzzy photos and focus on deploying rescue teams. However, there is a fundamental flaw in how these systems are currently built. If an AI model is trained on satellite photos of an earthquake in Turkey, it could completely fail to detect damaged buildings from a hurricane in Louisiana. This phenomenon, known as ‘domain shift’, happens because the AI gets confused by different camera angles, weather conditions, or regional architecture, rendering the tool useless for new, unseen disasters.
To solve this, researchers experimented with a technique called Supervised Domain Adaptation (SDA). They took a top-tier AI model originally trained on a massive global dataset of various disasters and fine-tuned it using a small batch of specific data from Hurricane Ida. Rather than just relying on standard RGB satellite images, they also fed the AI a variety of mathematically enhanced pictures. They tested ‘unsharp masking’ to highlight tiny cracks and splintered roofs, ‘contrast enhancement’ to spot subtle water damage, and ‘edge detection’ to make the outlines of buildings stand out.
The researchers found that Domain Adaptation was absolutely essential; without it, the AI failed to identify severely destroyed buildings entirely. When paired with ‘unsharp masking’, the model achieved its absolute best results, boosting its ability to detect ‘major damage’ by 190% and ‘destroyed’ buildings by an incredible 341% compared to baseline models. Interestingly, the researchers found that combining all the image enhancements at once actually confused the AI, proving that when it comes to training robust disaster-response tools, less is often more.
3. A deep learning framework for holistic urban planning

As I’m sure you all know, OpenStreetMap is one of the most useful free geospatial datasets out there. And I’m also sure you know the main issue with it: quality varies a lot by place. Some cities have really detailed road networks, building footprints, land-use polygons and points of interest. Others are patchier, especially in fast-growing or less well-mapped areas. A new paper in Scientific Reports looks at whether deep learning can help turn OSM into something more useful for urban planning. The case study is Krasnodar, a rapidly growing city in southern Russia, where the authors combine OSM with Sentinel-2 imagery, demographic data, traffic sensors and air-quality measurements.
The main idea is to build a single workflow that handles several planning tasks at once. The authors use different models for different jobs: a CNN for land-use classification, U-Net for building footprint extraction, LSTM networks for traffic forecasting, and a hybrid CNN-RNN model for short-term air-quality prediction. The results are pretty strong. The land-use model reached 91.6% accuracy, the building footprint model reached 94.0% accuracy, the traffic model had an RMSE of 3.6 vehicles per hour, and the air-quality model had an RMSE of 2.3 µg/m³ for PM2.5 forecasting. The framework also showed that OSM performed best for roads and buildings, while points of interest were less reliable, likely because they depend more heavily on voluntary tagging.
The useful part of this paper is the shift away from treating urban datasets as separate layers. Building footprints help make sense of urban structure, land-use classification helps identify functional zones, traffic prediction captures mobility pressure, and air-quality modelling adds an environmental layer. Together, these outputs can support things like zoning updates, green-space planning, congestion management and pollution monitoring. There are still some clear limits: the study is based on one city, OSM quality is uneven, and deep learning models can be expensive for smaller planning departments to run. But the broader direction is interesting: free geospatial data, satellite imagery and relatively standard deep learning models can now be stitched together into a pretty practical urban intelligence system.
4. Teaching AI to see the third dimension in satellite imagery
")
When it comes to analysing satellite imagery, most modern Vision-Language Models (VLMs) have a massive blind spot: they can only see in 2D. While these models are fantastic at looking at a flat image and identifying forests, roads, and buildings, they have absolutely no concept of height or terrain. This is a pretty big problem if you are trying to use AI for things like predicting where a flood will hit or assessing landslide risks, where the physical slope and elevation of the land are far more important than what it looks like from above.
To fix this vertical blind spot, researchers built GeoHeight-Bench, a new testing framework specifically designed to see if AI can understand height. Because getting experts to manually annotate the elevation of thousands of buildings and hills is incredibly expensive, the team used an automated AI pipeline to generate the data instead. The resulting benchmark forces models to tackle a range of 3D problems, from simply retrieving the exact elevation of a specific pixel, to identifying the tallest building in a city, to predicting which areas of a map are most likely to flood based on the terrain.
To prove that AI can actually learn to see in 3D, the researchers also built their own model called GeoHeightChat. Instead of just feeding the AI raw optical images, they used a two-stage training process to teach it how to implicitly guess the geometric structure of a landscape just by looking at a standard 2D photo. When tested on the new benchmark, GeoHeightChat completely blew the competition out of the water, scoring 44.14% overall compared to GPT-4o’s 21.61%. This proves that by injecting a sense of vertical scale into these models, we can unlock a whole new level of practical, real-world problem-solving for remote sensing AI.
You can check out the project page here.
Geospatial Datasets
1. High-altitude wetlands map

This newly developed dataset presents the very first global, high-resolution (30 m x 30 m) map of high-altitude wetlands across the world’s major mountain regions. The researchers combined Sentinel imagery, elevation data, and global ecoregion maps with machine learning to identify more than 30,500 km² of wetland ecosystems. The dataset is useful because high-altitude wetlands remain poorly mapped despite their importance for water storage, runoff regulation, and ecosystem functioning, particularly across remote mountain regions such as the Himalayas and Andes. You can access the data here and the code here.
2. Watershed hydrometeorological dataset

The MACH dataset compiles hydrometeorological data across 1,014 US watersheds, combining daily meteorological forcings with streamflow observations over a 44-year period, with some catchments extending back as far as 75 years. It also includes watershed-level attributes such as geology, topography, land cover, and climate characteristics. You can access the data here and the code here.
3. Climate-responsive crop selection dataset

This dataset explores how changing crop varieties and planting schedules could help agriculture adapt to climate change by simulating crop yields and water use for maize, wheat, soybean, and rice between 1961 and 2100. One of the more interesting aspects is its focus on adaptation timing, showing how relatively small shifts in sowing dates can substantially affect water demand and crop performance under warming conditions. You can access the data here and the code here.
4. European Atlantic wave climate dataset

A new dataset provides high-resolution projections of future wave conditions along the European Atlantic coastline using regionally downscaled CMIP6 climate simulations. The researchers generated 3-hourly directional wave spectra for more than 1,000 offshore locations across both historical (1985 to 2014) and future (2030 to 2059) periods under two emissions scenarios, including both integrated wave parameters and full spectral energy information. You can access the data here and the code here.
Other useful bits

An important new global assessment has applied the Red List of Ecosystems framework to mangroves for the first time, providing a detailed look at the pressures facing coastal ecosystems worldwide. The report finds that roughly half of global mangrove ecosystems are now considered at risk due to factors such as coastal development, sea-level rise, pollution, and changing sediment dynamics. Beyond the conservation implications, the assessment also highlights the growing role of geospatial monitoring in tracking ecosystem degradation and coastal resilience over time.
Vantor is partnering with Google Earth AI to integrate more advanced geospatial reasoning capabilities into its Tensorglobe platform. The aim is to move beyond basic object detection towards understanding more complex spatial behaviour and relationships within imagery and geospatial data. One of the more notable aspects is that these capabilities are being designed for classified and air-gapped environments, where many large AI systems are still difficult to deploy securely.
NOAA is using AI and cloud infrastructure to modernise weather forecasting workflows by migrating large volumes of historical climate and meteorological data into cloud-based systems. The broader goal is to speed up forecasting pipelines for extreme weather events and improve model efficiency, particularly as data volumes continue to grow. At the same time, NOAA officials have stressed that AI tools are intended to support rather than replace scientific expertise, especially for high-stakes forecasting decisions.
Google Earth is expanding its professional geospatial toolkit by adding global data layers and native Earth Engine raster support directly into its no-code interface. The update also includes an AI-powered feature called “Ask Google Earth”, which allows users to search for and visualise datasets using natural language prompts. The broader direction is fairly clear: reducing the technical barriers required to work with large-scale geospatial datasets and remote sensing products.
Jobs
TomTom is looking for a Staff UX Designer under their Map Visualisation team based in Amsterdam.
Esri is looking for a remote GIS Project Manager under their Assessment Department based in Canada.
Stantec is looking for a GIS Analyst under their Energy and Resources budiness unit based in Toronto.
EIB is looking for a Data Warehouse Officer based in Luxembourg.
Just for Fun
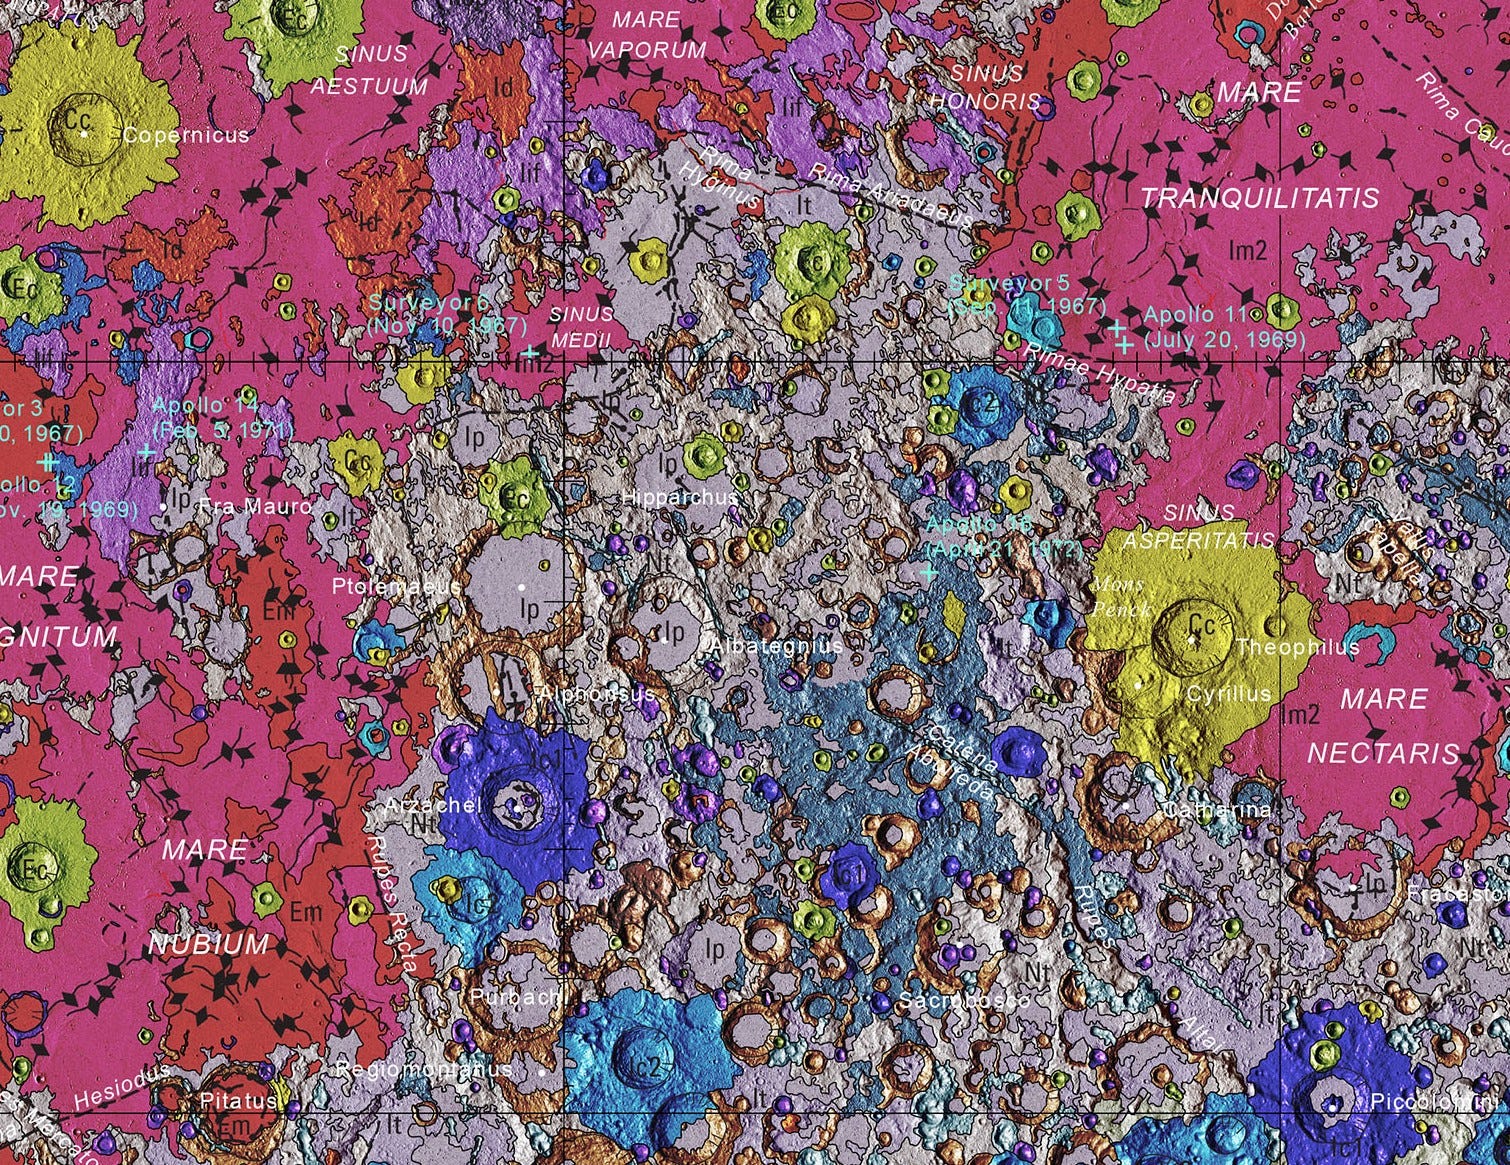
USGS has brilliantly released a seamless, globally consistent geologic map of the entire Moon at an incredible 1:5,000,000 scale.
That’s it for this week.
I’m always keen to hear from you, so please let me know if you have:
new geospatial datasets
newly published papers
geospatial job opportunities
and I’ll do my best to showcase them here.
Yohan