

🌐 Estimating granular GDP using several big data sources
PLUS: How Google's improving vision-language models for remote sensing and more.


Hey guys, here’s this week’s edition of the Spatial Edge — a weekly round-up of geospatial news. This newsletter is a bit like STATA — most data scientists have never heard of it, but a handful of economists seem to get some value from it. In any case, the aim is to make you a better geospatial data scientist in less than 5 minutes a week.
In today’s newsletter:
Granular GDP: Big data refines local economic estimates.
Google VLMs: Remote sensing sees better with new models.
Human Capital: The World Bank’s latest data portal.
Electricity Demand: India’s daily usage and weather insights.
EarthView Access: Millions of high-res images available for free on AWS.
First up, podcasts. My chat on the Open Beta podcast was just released. You can check it out here:
We discuss Europe’s renewable energy strategy and a bunch of different applications for geospatial data. We actually recorded this last August in Estonia. Six months and a shift in administration later, and it looks like my take on the green transition was a bit optimistic…
On to the newsletter.
Research you should know about
1. Estimating granular GDP using several big data sources

The holy grail in economic geography is high-quality, granular estimates of GDP. The problem with using datasets like nightlights (i.e. luminosity) as a proxy for economic activity is that it’s pretty difficult to interpret. A luminosity score of 35,000 doesn’t mean much unless you can link it directly to economic output.
That’s why there’s growing interest in producing pixel-level GDP estimates expressed in USD. It makes the data easier to understand.
A paper from researchers at the University of Chicago is the latest to take this task on. While previous attempts usually do this purely using nightlights, the main difference with this paper is that they’re using a bunch of geospatial datasets:
Nightlights (from NASA’s Black Marble)
Gridded population data (from Landscan)
Land use categories (from NASA MODIS MCD12Q1)
Carbon emissions (from EDGAR)
Net primary productivity (from NASA’s MODIS MOD17A3HGF)
They train a random forest model using subnational GDP data from a mix of countries, and then use it to predict GDP at resolutions as fine as 0.25° grid cells, from 2012 onwards.
The training data includes both developed and developing countries, but the underlying data quality varies. Countries like the U.S. have reliable subnational GDP data. Others don’t.
For predicting GDP levels of regions, they obtain an R2 of 0.92 to 0.98, which is incredibly impressive. While for GDP growth, they have an R2 of 0.62 at the low end.
To further test how well the model performs, they hold out China from the training set and use it for validation. For pre-2019 annual GDP changes, the model achieves an R² of 0.31 (i.e. moderate at best). But post-2019, once China standardised its subnational GDP reporting, model performance jumps to 0.58+. The authors attribute the earlier weakness to inconsistent official data, but it raises a broader concern: if the model struggles to detect trends in one well-documented country, how well does it perform in places with weaker or noisier data?
The paper’s approach is pretty ambitious, and the models do well at predicting overall GDP levels. Still, I have a couple of questions about its design choices. One example is the decision to include CO₂ emissions as an indicator of local economic output, which might be less useful in places where growth has already begun to “decouple” from emissions. This could become a challenge when the model encounters countries quite unlike those in the training set. I.e. if their industries produce more GDP with fewer emissions, the correlation might be weaker.
To address this risk, the authors use a form of “K-fold cross-validation” at the country level. In short, they leave entire countries out of the training data, then test the model’s ability to predict GDP in these excluded countries. This helps them confirm whether the patterns learned in one group of nations can genuinely generalise elsewhere.
It’s also worth noting that the model seems to predict GDP levels better than growth rates. That aligns with what I’ve seen elsewhere. I.e. nightlights and other big data sources seem to be too noisy and volatile to reliably track short-term growth. They’re better for mapping the economic landscape than measuring its shifts.
However, at the end of the day, it’s worth noting some findings from the Gibson et al. (2024) paper, which I covered a couple of months ago. One of their main takeaways is that the relationship between GDP and nightlights, known as the ‘GDP-luminosity elasticity’, varies with the level of spatial aggregation.
Gibson et al. find that in China:
At the province level, the elasticity ranges from 0.42 to 0.66
At the county level, it drops to between 0.05 and 0.18
This is because nightlights are noisy at small scales. At higher levels, the noise averages out. At lower levels, bright infrastructure (like ports or roads) or low-light service hubs distort the signal.
Another issue Gibson et al. discuss is model generalisation. If a model is trained on province-level data and applied to district-level predictions, the learned relationships may not hold. For instance, a brightly lit industrial zone might inflate GDP estimates across several districts, even if the economic activity is concentrated in one.
So while the paper presents a useful method for estimating GDP at granular levels, care is needed in applying it, particularly across different scales or in contexts with limited or noisy data.
Hat tip to Firat Gundem for the heads up about the paper.
2. How Google is improving vision language models for remote sensing applications
A study published by the Google Research team introduces a new (and better) way to train vision-language models (VLMs) for remote sensing tasks. The team tackles the common problem of limited labelled data in aerial and satellite imagery. This often holds remote sensing back from developing better foundation models. To get around this, they built two large-scale image-caption datasets.
VLMs help make sense of remote sensing imagery by linking visuals to text, which can be useful for things like mapping, environmental monitoring, or emergency response.
The researchers created the RS-WebLI dataset by filtering millions of images from an existing web-scale collection. They also introduced RS-Landmarks, a new dataset with 18 million satellite and aerial images, each paired with short captions generated by Gemini using Google Maps. They trained a relatively small model (800 million parameters in total) using contrastive learning from MaMMUT. Their model achieved top performance on standard benchmarks for zero-shot image retrieval in remote sensing.
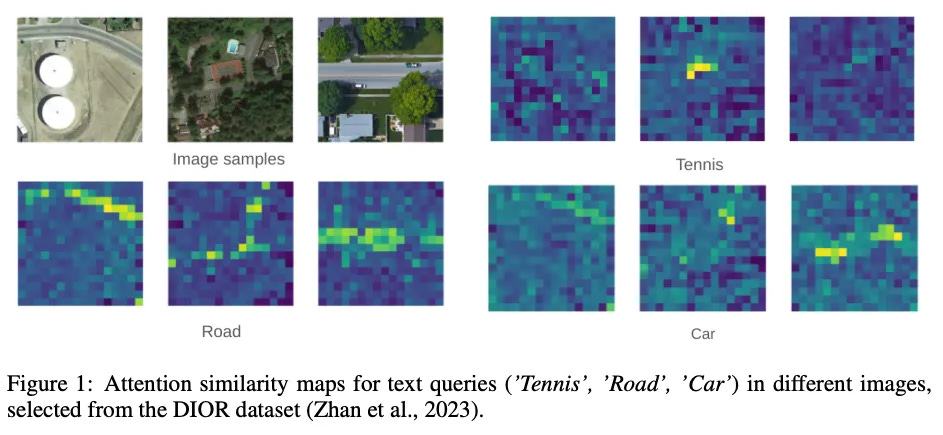
They also proposed a self-supervised method to improve segmentation by generating pseudo-labels from the model’s own attention maps, which highlight areas in an image related to a text query.
Overall, the paper shows that it’s possible to train domain-specific VLMs for geospatial tasks like open-vocabulary object detection, zero-shot segmentation, and even text-to-image generation. The authors suggest their datasets and methods could support more advanced remote sensing work in the future, especially in tasks that need more precise localisation.
Geospatial Datasets
1. Human capital data portal

The World Bank’s new Human Capital Data Portal provides up-to-date, disaggregated data across life stages on health, education, and employment. Users can explore interactive visualisations, compare indicators across countries, and access research and insights to support evidence-based policymaking.
2. Electricity demand data

This new open-access dataset offers daily electricity demand and meteorological data for all Indian states from 2014 to 2024. It includes daily energy supply (GWh), peak power (MW), and unmet demand, along with state-level weather data for model training. You can read the pre-print here.
3. Geological map database

Macrostrat is the world’s largest open-access geological map database. It covers over 2.5 million geological polygons and 50,000 stratigraphic names. And if you don’t know what stratigraphic means, then you’re not alone.
Other useful bits

China recently launched Manus, the world’s first fully autonomous general-purpose AI agent. It’s being called China’s second DeepSeek moment. Manus thinks, plans, and acts on its own, running in the cloud like an invisible assistant that never sleeps. It’s a pretty big leap in AI autonomy.
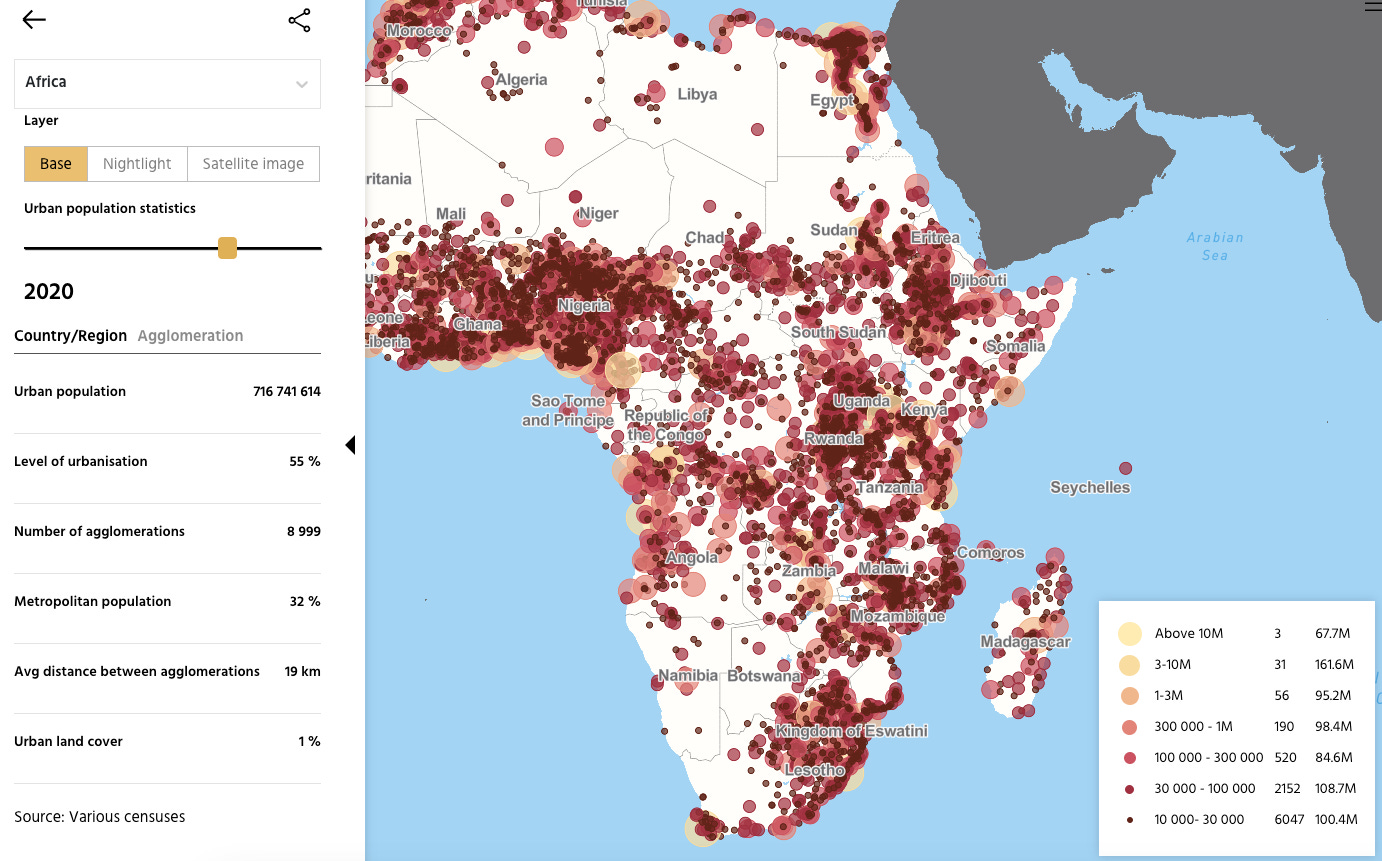
According to the OECD report “Africa’s Urbanisation Dynamics 2025”, Africa’s urban population is set to double to 1.4 billion by 2050. Check out the interactive map (and more) here.
Satellogic’s EarthView dataset is now openly available on AWS through the Open Data Sponsorship Program. With over 7 million high-res satellite images in COG format, it’s a huge win for anyone working in EO, climate, agri, or urban planning. In fact, I’m using this myself at the moment.
A new study finds that GIS is a growing opportunity for IT professionals, due to overlapping skills and rising demand in fields like urban planning and environmental monitoring. It encourages IT workers to explore careers in GIS and calls for more educational pathways to support the shift. (I’m glad to know we don’t have to shift careers just yet.)
Strava just rolled out a big maps update with lifelike 3D terrain, satellite imagery, and new winter-focused layers like avalanche risk and slope aspect.

Jobs
Meta is looking for a Software Engineering Manager for Product Infrastructure in California.
Ai2 is looking for a Lead Machine Learning Engineer for their new platform, Earth-System, in Seattle.
The Tony Blair Institute for Global Change is looking for a part-time Manager, Geoportal who will be embedded within the Ministry of Digital Economy and Transformation (MENTD) of the Government of Togo.
CGI is looking for a Project Manager under their Space Division in Bochum.
Just for Fun

Each of the 48,741 dots in this image is a galaxy. Not a star, but a galaxy. The width of this image is 6 billion light-years. For context, the universe is thought to be around 100 billion light years…
That’s it for this week.
I’m always keen to hear from you, so please let me know if you have:
new geospatial datasets
newly published papers
geospatial job opportunities
and I’ll do my best to showcase them here.
Yohan