

🌐 New surprising facts about nightlights data
PLUS: predicting wildfire spreading, using AI to improve crop mapping, and more.


Hey guys, here’s this week’s edition of the Spatial Edge — a weekly round-up of geospatial news. We’re a newsletter that’s more niche than Sentinel-3… The aim is to make you a better geospatial data scientist in less than 5 minutes a week.
In today’s newsletter:
Nightlights Data: Surprising GDP links challenge earlier assumptions.
Wildfire Spread: Improving final burn predictions using deep learning.
Crop Mapping: Transformers outperform CNNs in segmentation tasks.
NASA Climatology: Monthly emissivity products from 2003 to 2021.
Small Fires: New high-resolution dataset since 1990.
Research you should know about
1. Some new surprising facts about nightlights

In past newsletters, I’ve covered some quirky aspects of nightlights data—like how it struggles with LED streetlights or gets thrown off by snow reflections (more on that here). But a working paper by John Gibson, Bonggeun Kim, and Chao Lik drops some new, surprising insights on how nightlights relate to GDP.
First, the relationship between GDP and nightlights isn’t as stable as many models assume. It changes dramatically depending on whether you’re analysing data at the national, provincial, or district level. For instance, in developing countries like China and Indonesia, metro areas show a much stronger link between GDP and nightlights than rural ones. This makes sense—cities grow by lighting up new areas, while rural growth often flies under the radar. In the U.S., it’s even weirder: lights are dimming while GDP grows, likely thanks to energy efficiency and shifts in how economic activity uses lighting.
They also find that the GDP-nightlights relationship at the national level is massively different from what you see at the local level. This is a big deal because it challenges a bunch of studies that train models on national-level data to estimate local GDP from nightlights. Turns out, what works for a whole country doesn’t hold up when you zoom in.
Second, changes in nightlights mostly come from new areas being illuminated (i.e. the ‘extensive margin’ of nightlights), rather than existing areas getting brighter. For example, when farmers in Iowa see higher incomes (say, from a grain price boom), they might extend diner hours or install a few extra lights. Satellites can barely pick this up. But if those farmers buy winter homes in Phoenix, triggering new housing developments with permanent streetlights, that expansion shows up clearly. This highlights a pretty big limitation of nightlights data—it captures urban sprawl well but struggles with subtler, localised economic shifts.
This idea (known as the ‘ratchet effect’) throws a major wrench into Henderson et al.'s landmark 2012 study on nightlights and economic activity. If most of what nightlights capture is expansion, not intensification, it challenges the way we’ve been using this data to measure economic growth.
2. Predicting wildfire burn areas from space

A new paper published in Computers and Geosciences introduces a wildfire prediction framework called Fire-Image-DenseNet (FIDN). FIDN uses deep learning to predict the final spread of wildfires. It combines satellite fire data from the first three days of ignition with meteorological and land cover information to model over 300 major wildfire events across the western U.S.
The model uses DenseNet layers to analyse spatial patterns in burned-area imagery, while factors like vegetation, slope, and wind are processed through smaller encoders. These features are merged and passed through deconvolution layers to predict the fire’s final spread.
The main takeaway:
FIDN massively beats existing models, achieving 97% structural similarity, reducing errors by 82%, and running dramatically faster than traditional methods like cellular automaton models.
It’s a lightweight model that doesn’t require complex fire behaviour inputs and is open-source for others to build on.
You can access the code here.
3. Crop segmentation using transformers

Most existing studies on crop mapping are done using random forests or U-Nets. But with the rise of large language models, transformers are all the rage these days.
So it’s no surprise that we’re seeing transformer-based approaches to crop segmentation.
A new study introduces Swin UNETR, a transformer-based model adapted to identify crop types in satellite image time series. Originally designed for segmenting 3D medical scans, Swin UNETR was modified to handle satellite imagery.
It processes 32-date multispectral patches as a 3D input (height, width, and time) through a Transformer encoder. The model’s decoder is customised to produce crop-type maps, with performance evaluated using metrics like accuracy and F1 scores. The results? Swin UNETR hit around 95% accuracy and matched or outperformed CNN benchmarks like UNet3D all while being more efficient
You can access the code here.
Geospatial datasets
1. NASA climatology datasets
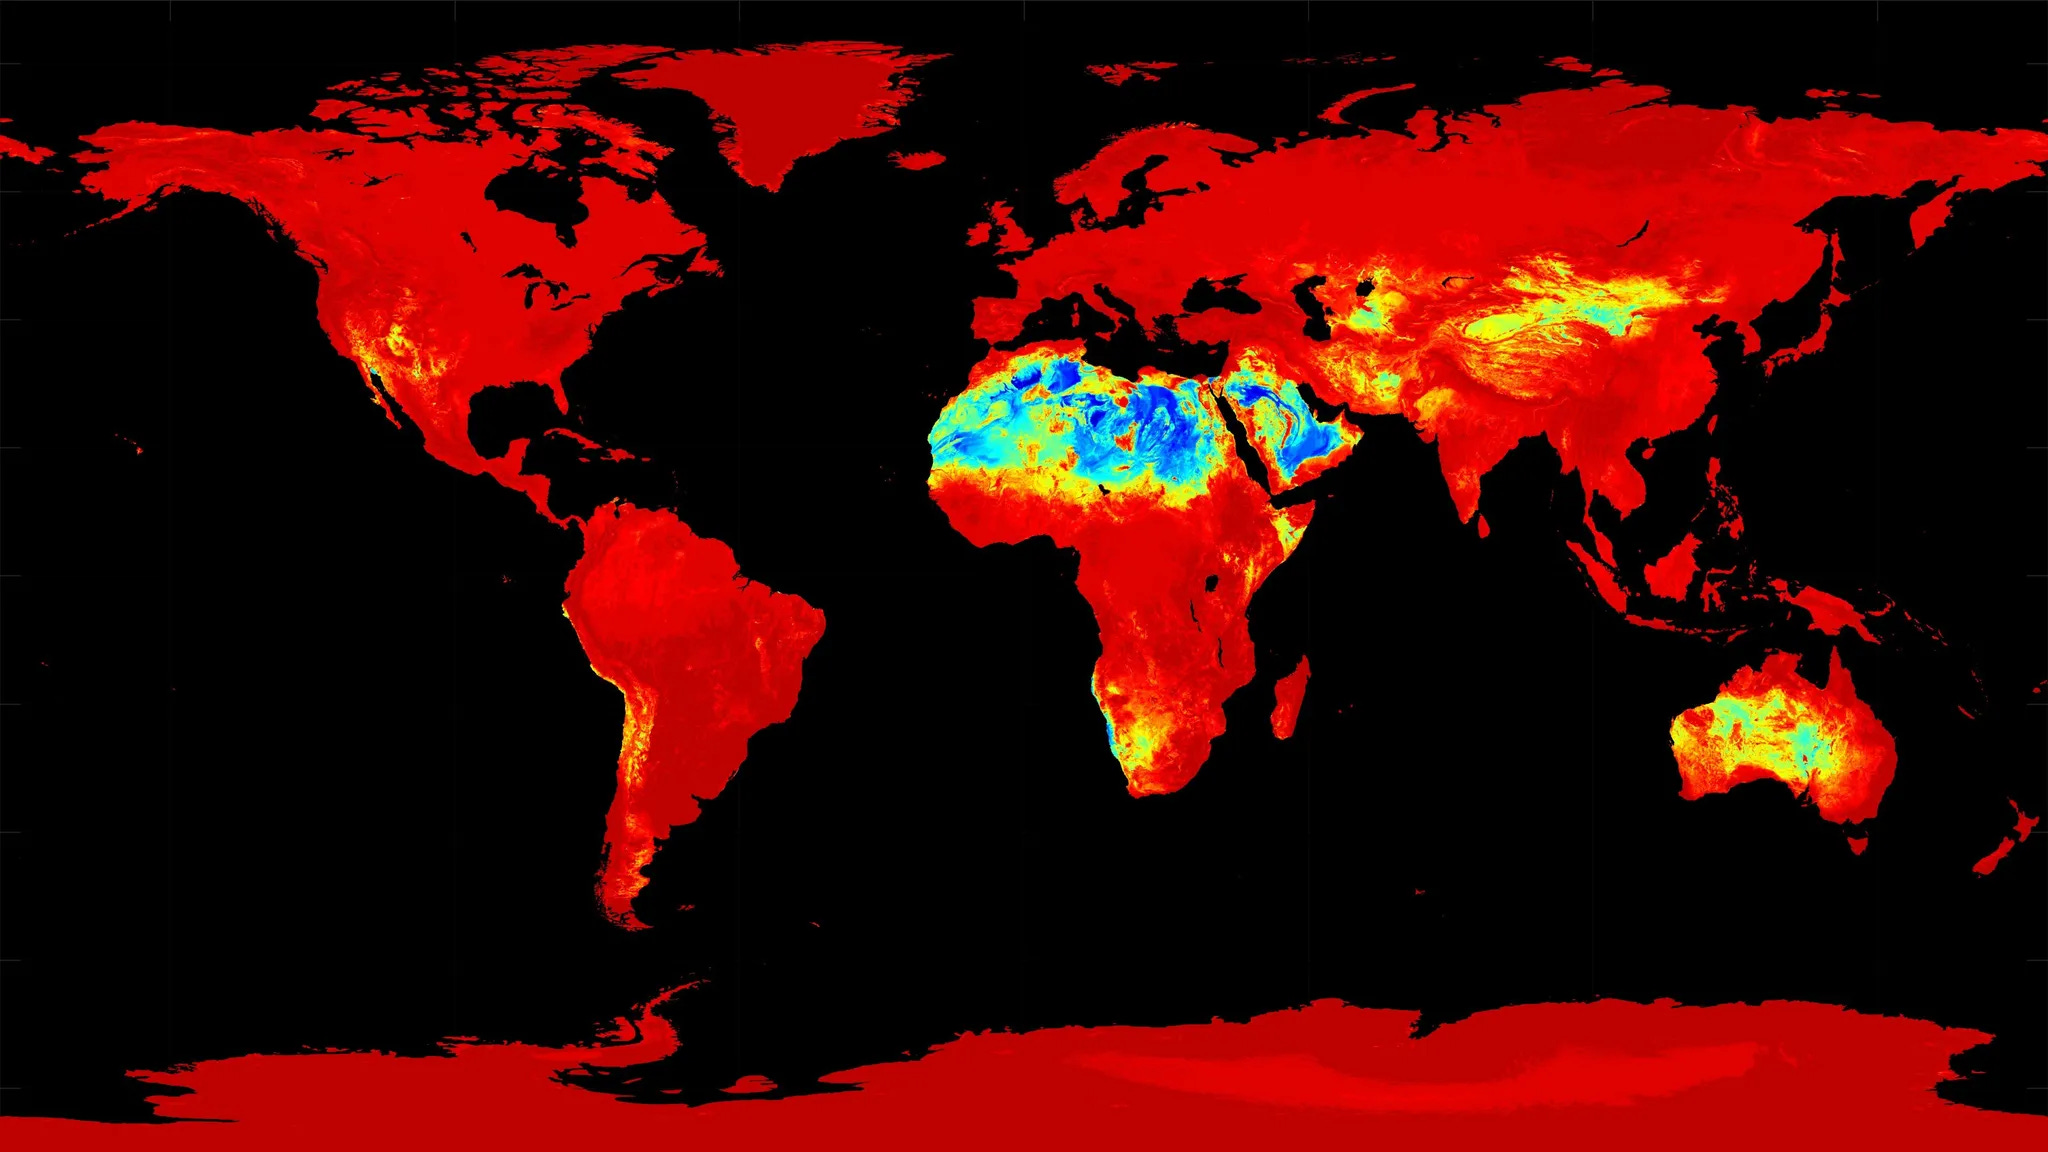
NASA's LP DAAC has released the CAMEL V003 Climatology product suite, combining data from ASTER and MODIS to provide monthly global emissivity climatology from 2003 to 2021.
You can explore the datasets and access them here:
The data is also available for download here.
2. Long-term small fire dataset

The Long-Term Small Fire Dataset (SFDL) offers high-resolution burned area data for three key regions: Amazonia, Sahel, and Siberia, covering 1990–2019. It’s available at a 30 m resolution. You can learn more about the ESA Fire Disturbance Project and its datasets here.
3. Moving vehicles detection dataset

The Small and Dim Moving Cars (SDM-Car) dataset addresses the challenge of detecting faint vehicles in satellite videos. Using 99 high-quality videos from the Luojia 3-01 satellite, the dataset focuses on vehicles that blend into their surroundings. You can access the dataset and its tools here.
Other useful bits

The Overture transportation theme is moving from beta to general availability, focusing on trust in its schema, quality road geometry, and stable GERS IDs. Recent updates include adding a new "connectors" property for better routing and removing unused "lanes" for a cleaner schema. Feedback on data quality and core use cases like mapping and routing is encouraged as they refine throughout 2025.
AI models can "fake alignment"— acting compliant during training but reverting to risky behaviours post-deployment. Anthropic’s study found Claude 3 Opus strategically handles harmful requests differently based on user type, raising concerns about future AI training.

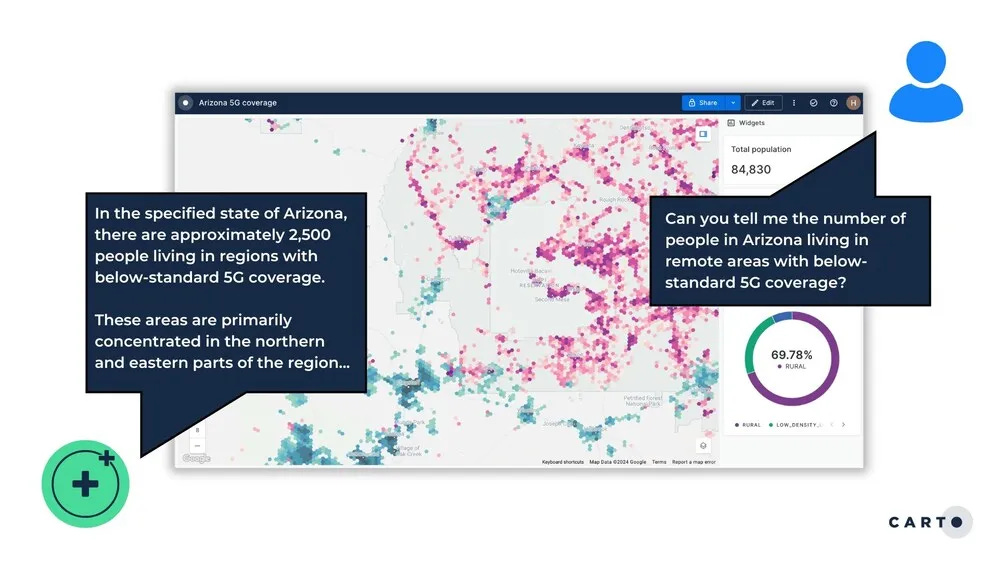
CARTO has launched AI Agents, a new tool using AI and geospatial technology to simplify spatial analytics for users of all backgrounds. They also don’t require any coding to use.
Rlinguo is a mobile app that runs R directly on your phone. R-based native mobile apps are probably something that no one has ever asked for, but I do find it pretty cool.
Jobs
The London School of Economics ESRC Doctoral Training Partnership is offering a Collaborative Studentship for the project, “The territorial impacts of Big Science.”
LiveEO is looking for a Senior Project Manager in the field of AI and Satellite Data.
UNGSC is looking for an Associate Geospatial Information Officer under its Analytics and Location Intelligence Unit (ALIU).
The Armed Conflict Location & Event Data organization (ACLED) is looking for a Junior Data Scientist to assist with its data science projects.
CopPhil, an EU-Philippines initiative, is offering a Master’s Scholarship for folks in the field of Earth Observation.
Just for Fun

Sri Lanka has the lowest gravity on Earth. This is supposedly due to its proximity to the equator and the thickness of the crust (which is about 17km, as opposed to the global average of 30-50km).
That’s it for this week.
I’m always keen to hear from you, so please let me know if you have:
new geospatial datasets
newly published papers
geospatial job opportunities
and I’ll do my best to showcase them here.
Yohan