🌐 How JP Morgan is using nightlights data
PLUS: How Google is incorporating search trends data into geospatial modelling, the cost of electrifying households in Africa, and more
Hey guys, here’s this week’s edition of Spatial Edge — a weekly round-up of geospatial news that’s more niche than GeoDa. The goal is to help make you a better geospatial data scientist in less than 5 minutes a week.
In today’s newsletter:
Nightlight Pre-processing: Improves hurricane damage estimations.
Google Search Trends: Improving geospatial models with search data.
Net-Zero Pledges: Require land larger than the U.S.
Electrifying Africa: Costs for household electrification by 2030.
Power facility geospatial dataset: Covers coal, oil, gas, wind, solar and more.
Research you should know about
1. How pre-processing nightlights impacts Hurricane damage estimations
A team from JP Morgan (yes you heard that right), explores how different pre-processing methods of nighttime light data can improve the estimation of hurricane-induced economic damages.
They use two satellite-based nighttime light datasets:
VIIRS Stray Light Corrected Nighttime Day/Night Band (VSC-NTL) and
NASA's Black Marble product (VNP46A2)
They examined four major hurricanes in Florida—Michael, Matthew, Irma, and Harvey—analysing data at the zip code level.
Various pre-processing techniques were applied, including value thresholding (filtering out anomalous light values), built masking (using Sentinel-2's Dynamic World dataset to focus on built areas), and quality filtering with imputation (enhancing data quality and filling gaps). By comparing the processed nighttime light data with economic damage estimates from KatRisk's catastrophe model, they assessed which methods provided the strongest correlation with actual damages.
They found that the choice of pre-processing significantly affects the correlation between nighttime light data and economic damage. Specifically, applying quality filtering and imputation to the VNP46A2 dataset resulted in a correlation coefficient of 0.761 with the damage data.
And if you’re interested in learning more about why I’m always going on about the need for better pre-processing of nightlights, check this post out.
2. Using Google search trends in geospatial models
A new paper from Google Research uses aggregated Google Trends data to improve geospatial modelling. They aim to boost health, demographic and environmental predictions using search terms, to offer a ‘human-centric’ approach to understanding spatial patterns.
They collected the top 1,000 search queries for over 28,000 US zip codes. This was used to create "search signatures"—i.e. profiles that represent local online interests and concerns.
These signatures were used as key input variables for predictive models. They applied simple linear models, like Ridge regression, to predict various community-level variables using publicly available datasets, including health data from the CDC, census demographics, and environmental information like tree cover and elevation. The study compared their method against traditional spatial interpolation methods such as Inverse Distance Weighting (estimating values based on nearby locations) and hierarchical median imputation (using median values from larger areas).
The results showed that these search signatures better predicted missing data and outperformed traditional methods (achieving an average R² score of 0.74 across 21 health variables and 0.80 across six demographic and environmental variables).
3. How much land is needed for net-zero climate pledges?
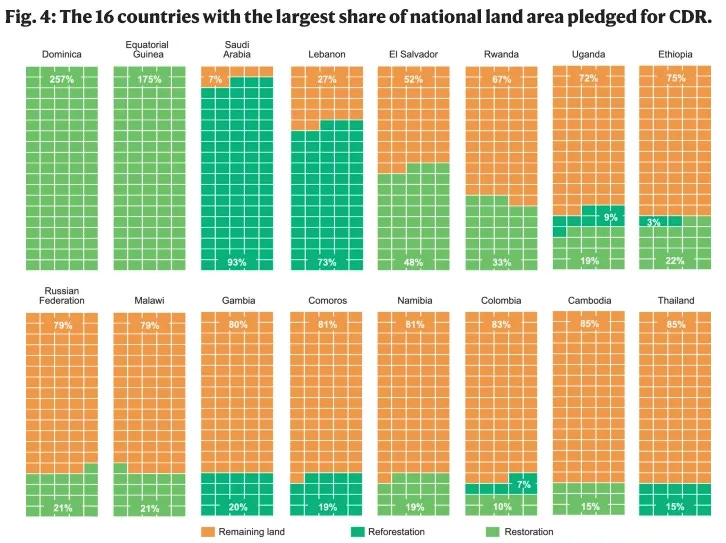
A new study published in Nature Communications highlights the massive land demands embedded in countries' net-zero climate pledges. Achieving these pledges requires about one billion hectares of land for carbon dioxide removal—an area larger than the United States.
The team analysed climate pledges from 194 countries by reviewing their Nationally Determined Contributions (NDCs) and Long-Term Low Emissions Development Strategies (LT-LEDS) submitted to the UNFCCC. They used geospatial datasets from the Food and Agriculture Organization (FAO) for land cover and land use, and the Climate Analysis Indicators Tool for national greenhouse gas emissions profiles. To estimate tree density per hectare, they used data from Crowther et al.
By converting emissions-based pledges into land area, they categorised activities into those involving land-use change—like converting non-forested lands to forests or bioenergy crops—and those focusing on restoring existing ecosystems.
They found that over 40% of the pledged land area (~435 million hectares) would involve converting existing land uses into forests or bioenergy crops, which could disrupt food production and biodiversity. The remaining 555 million hectares aim to restore degraded ecosystems. Four countries—Russia, Saudi Arabia, the US, and Canada—account for over 70% of the total land area pledged.
Apparently implementing these pledges could require land-use changes at a rate of up to 13 million hectares per year, which is an unprecedented rate.
4. How much does it cost to electrify households in Sub-Saharan Africa by 2030?
Researchers from ETH Zurich have examined the cost of electrifying households in 40 Sub-Saharan African countries by 2030.
Using the open-source electrification tool OnSSET, the team estimated detailed, location-specific costs for different electrification options. They used high-res population data at 100 m × 100 m, existing and planned grid infrastructure from the World Bank, and country-specific factors like technology costs and financing conditions.
The model assessed three approaches:
grid extension
solar-powered mini-grids
standalone solar systems
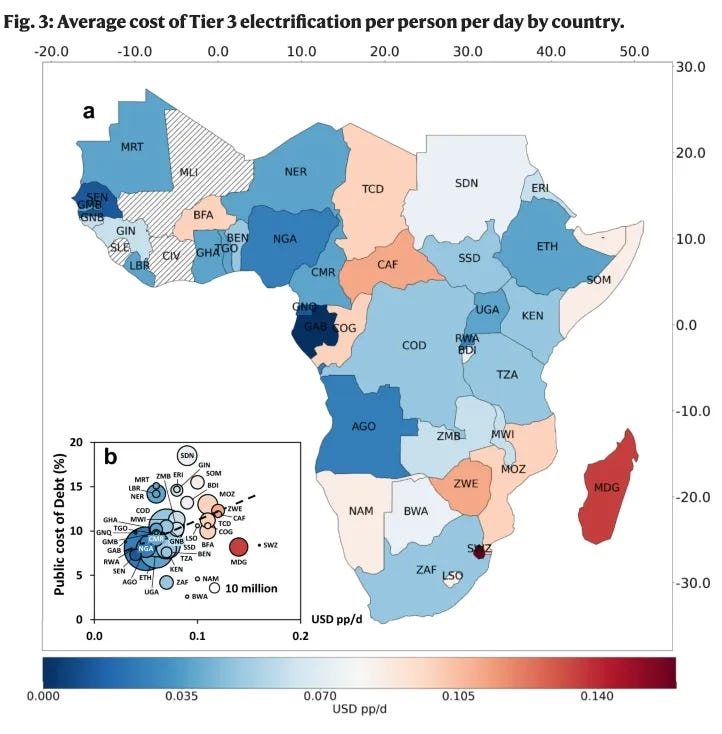
They found that solar mini-grids and standalone systems can significantly reduce the cost of electrifying remote and high-cost areas, especially for lower energy tiers. On average, least-cost electrification at Tier 3 (about 365 kWh per household per year) can be achieved for $0.14 USD per kWh or $0.07 USD per person per day.
The study reveals that costs are sensitive to demand assumptions; overestimating demand can lead to substantial cost increases. Nonetheless, I think it’s pretty useful to visualise variances in costs within countries.
Geospatial datasets
1. Global Integrated Power Tracker
Global Energy Monitor’s Global Integrated Power Tracker (GIPT) tracks 116,000 power facilities across the world. This includes coal, oil, gas, nuclear, geothermal, solar, wind and hydro power facilities. It captures a bunch of useful info on unit capacity, status, ownership, fuel type, start year, retirement date, and more. The data is freely available as a single download.
2. Oil spill detection dataset
This study from Scientific Data offers a comprehensive dataset specifically for detecting oil spills in port environments. It includes 1,268 drone-captured RGB images, carefully annotated into three categories—oil, water, and other—under a bunch of different lighting and environmental conditions.
3. NPKGRIDS dataset
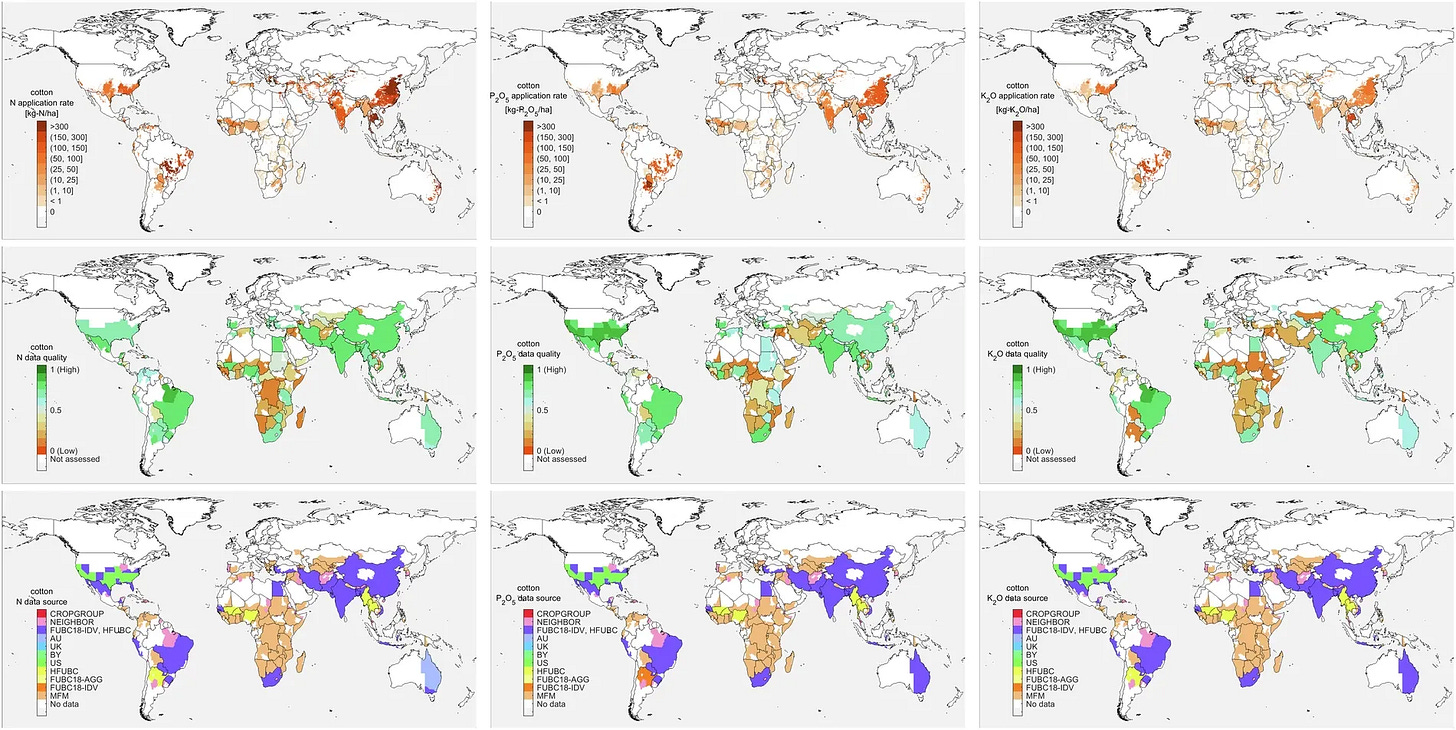
The NPKGRIDS dataset maps nitrogen (N), phosphorus (P2O5), and potassium (K2O) fertilizer application rates for 173 crops globally at a 5.6 km spatial resolution for the year 2020.
You can access the dataset and code here.
4. AllClear dataset
The AllClear dataset is a benchmark dataset for cloud removal models. It includes over 4 million images from 23,742 global regions captured in 2022 from Sentinel-1, Sentinel-2 and Landsat.
Other useful bits
HERE Technologies is expanding its partnership with Maxar Intelligence to advance AI-powered mapmaking using Maxar’s high-res satellite imagery. The bottom line is that they’re aiming to automate map updates to make it more timely.
One day left to join the Google Photorealistic 3D Maps Challenge, a hackathon inviting developers to create immersive web experiences using Google's Photorealistic 3D Maps in the Maps JavaScript API. Participants can submit projects in categories like location discovery, immersive marketing, and built environment & sustainability.
Researchers at RMIT University in Australia have developed a satellite imaging technique that identifies plastic waste on remote beaches by detecting unique spectral features of plastics.
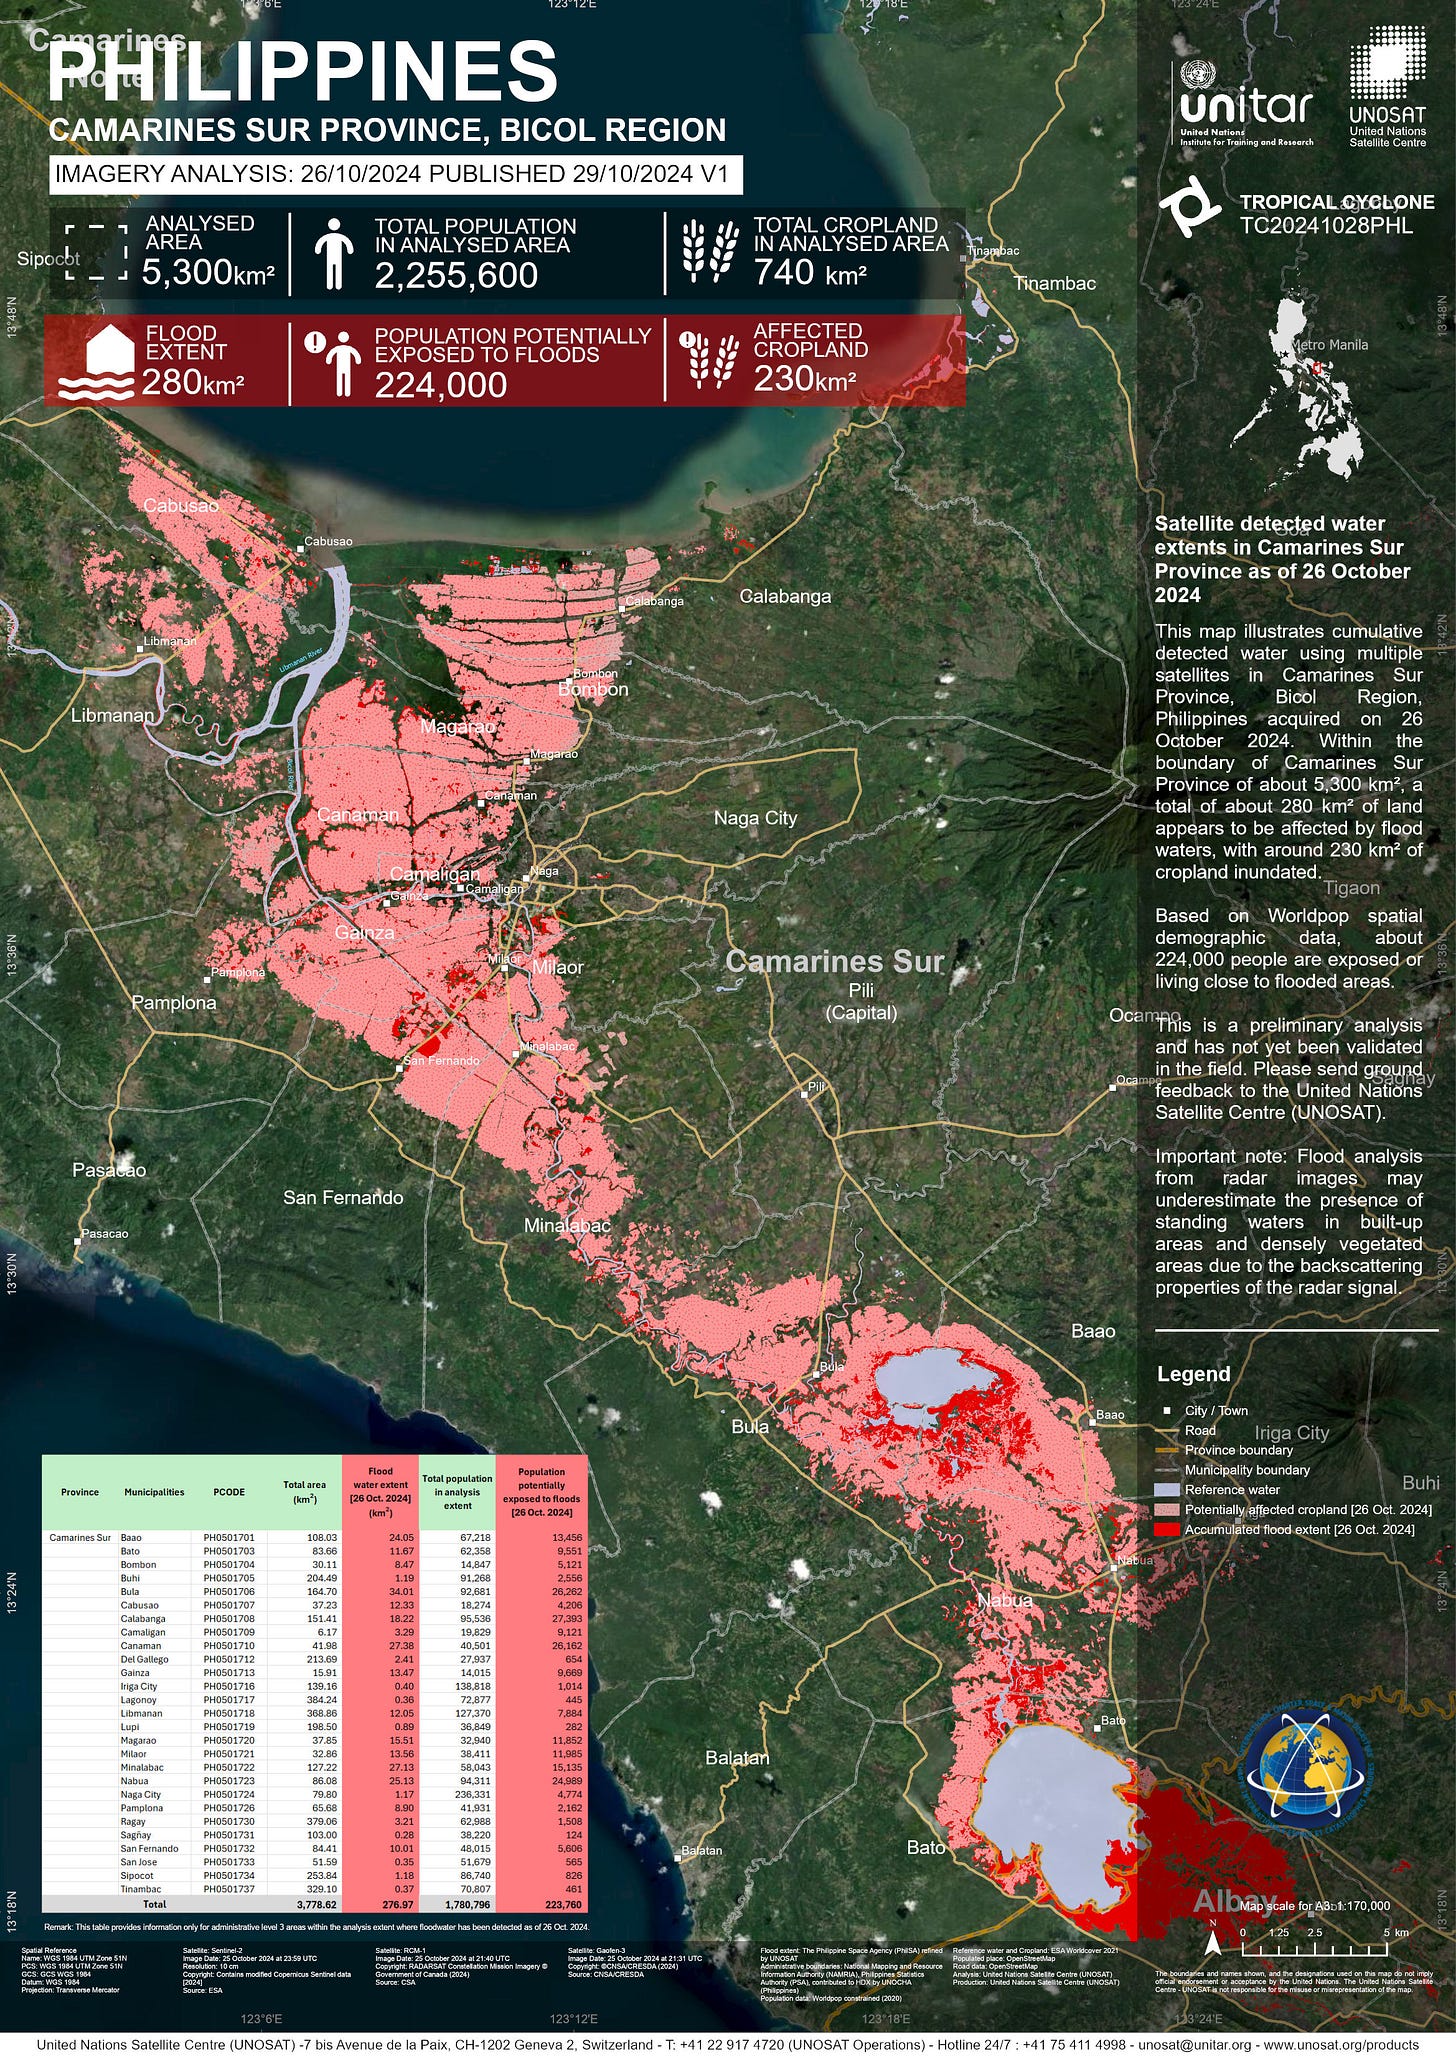
The United Nations Satellite Centre has released detailed impact maps from Tropical Storm Trami, showing flooding and landslide/mudflow areas in the Philippines. These maps help assess the storm's effects on response and recovery efforts.
Contribute to an international tree species classification database by sharing aerial RGB/RGBI imagery and manual tree species annotations. The deadline is on 30 November.
Jobs
The UN’s World Food Program is looking for a Geographic Information System Consultant who will support activities related to their Global Assurance project rollout.
ESA is looking for a Head to lead their Earth and Mission Sciences Division.
UNICEF is looking for a Chief of the Computational Analytics and Geospatial Intelligence Unit who will report to the Chief Statistician.
Luxoft is looking for a GIS Data Engineer to help primarily with their Advanced Driver Assistance Systems (ADAS).
IMPACT Initiatives is looking for a Remote Sensing and Climate Specialist under their Global Emergency Unit.
The University of Edinburgh is looking for a PhD candidate with a background in geography and geosciences, computer/data sciences, ecology and social sciences.
Just for Fun
Sunset as seen from the International Space Station (courtesy NASA).
That’s it for this week.
I’m always keen to hear from you, so please let me know if you have:
new geospatial datasets
newly published papers
geospatial job opportunities
and I’ll do my best to showcase them here.
Yohan


