

🌐 Mapping biodiversity using sound
PLUS: examining plane crashes using satellites, predicting water quality with explainable AI, and more.

Hey guys, here’s this week’s edition of the Spatial Edge — a newsletter that’s almost as niche as the Julia programming language. In any case, the aim is to make you a better geospatial data scientist in less than five minutes a week.
In today’s newsletter:
Biodiversity mapping: NASA’s BioSoundSCape records 825,000 minutes of audio
Plane turbulence: Satellites help explain the Singapore Airlines incident
Water quality: Explainable AI predicts river conditions in India
Foundation models: Lessons from deploying Presto in WorldCereal
Vegetation maps: Global 30m median vegetation dataset released
Research you should know about
1. Mapping biodiversity using sound

A new dataset called BioSoundSCape has been released as part of NASA’s BioSCape project. It’s focused on the Greater Cape Floristic Region (GCFR) in South Africa. The GCFR is home to the Fynbos biome, a global biodiversity hotspot with super high rates of endemism among plants, birds, and amphibians. To capture how biodiversity varies across this landscape, researchers used over 500 autonomous recording units (ARUs) during both the wet and dry seasons of 2023. These small devices recorded one minute of sound every ten minutes. This ended up generating more than 825,000 minutes of audio data. Each recording is georeferenced to within 20 metres, creating a detailed sound-based map of ecological activity across nearly 120,000 square kilometres.
The project combines bioacoustics with remote sensing. The recording units capture soundscapes made up of biophony (animal calls), geophony (natural sounds like wind and rain), and anthrophony (human-made noise). This creates a continuous, non-invasive record of species presence and behaviour, covering everything from nocturnal frog calls to the impact of nearby roads. By linking these recordings with satellite and airborne data on vegetation, fire history, and habitat structure, scientists can study how biodiversity responds to both natural and human-driven changes. This kind of integration is pretty useful in regions like the GCFR, where fire regimes, climate pressures, and invasive species are rapidly reshaping ecosystems.
The result is one of the largest bioacoustic datasets ever assembled for a biodiversity hotspot. Because the recordings are preserved in their raw form, they can be re-analysed with new methods as technology improves. The dataset is publicly available through NASA’s ORNL DAAC and is supported by open-source code, which makes it an important resource for conservation planning and long-term ecological monitoring.
2. Assessing plane crashes using satellites

On 21 May 2024, Singapore Airlines flight SQ321 hit severe turbulence while crossing Myanmar at cruising altitude, leading to one fatality and dozens of injuries. A new study in Scientific Reports combines satellite observations from Himawari-8/9, atmospheric profiles from Formosat-7/COSMIC-2, and ADS-B flight data to piece together what happened. The aircraft flew directly into deep convective clouds that were rapidly building, with tops soaring to 55,000 feet and cloud-top temperatures as cold as –80°C.
The satellite data showed that the convective system developed quickly between 06:00 and 07:40 UT, right before the encounter. CAPE values of around 700 J/kg suggested vertical air velocities of up to 38 metres per second, generating G-forces between 0.85g and 1.15g. That range is enough to lift unbelted passengers out of their seats. ADS-B records confirm altitude swings between 36,875 and 37,500 feet over a 68-second window, lining up with the worst of the turbulence.
The study highlights how short-lived but violent these episodes can be, and how critical steady flight speed and seatbelt use are for safety. It also points to the limits of cockpit radar when facing clusters of towering convective clouds. Real-time satellite data, better integration of GPS-based atmospheric profiles, and stronger pilot and passenger awareness could all help. With climate change likely to intensify convective activity, these insights are already shaping discussions on how airlines prepare for and respond to turbulence.
3. Predicting water quality with explainable AI

Monitoring water quality is pretty important for both ecosystems and public health. Historically, this meant a bunch of expensive lab-based tests of physical, chemical, and microbial properties such as dissolved oxygen, pH, conductivity, and coliform counts. These snapshots were accurate but limited in scope. A new study in Scientific Reports shows how machine learning can move things forward by using ensemble regression models combined with explainable AI.
The researchers trained six algorithms (XGBoost, CatBoost, Random Forest, Gradient Boosting, Extra Trees, and AdaBoost) on nearly 2,000 river water samples from India. By stacking these models into a single framework with Linear Regression as the meta-learner, they achieved very high predictive performance, with R² values close to 0.995 and root mean square error close to one. CatBoost and Gradient Boosting were the strongest standalone models, but the stacked ensemble significantly reduced error rates and generalised better to new data.
To make the system transparent, the authors used SHAP, a popular explainable AI method. This revealed that dissolved oxygen, biochemical oxygen demand, conductivity, and pH were the most important features influencing predictions. The framework is designed to work with real-time sensor networks, making it scalable and suitable for continuous monitoring.
4. Lessons from bringing foundation models into the real world
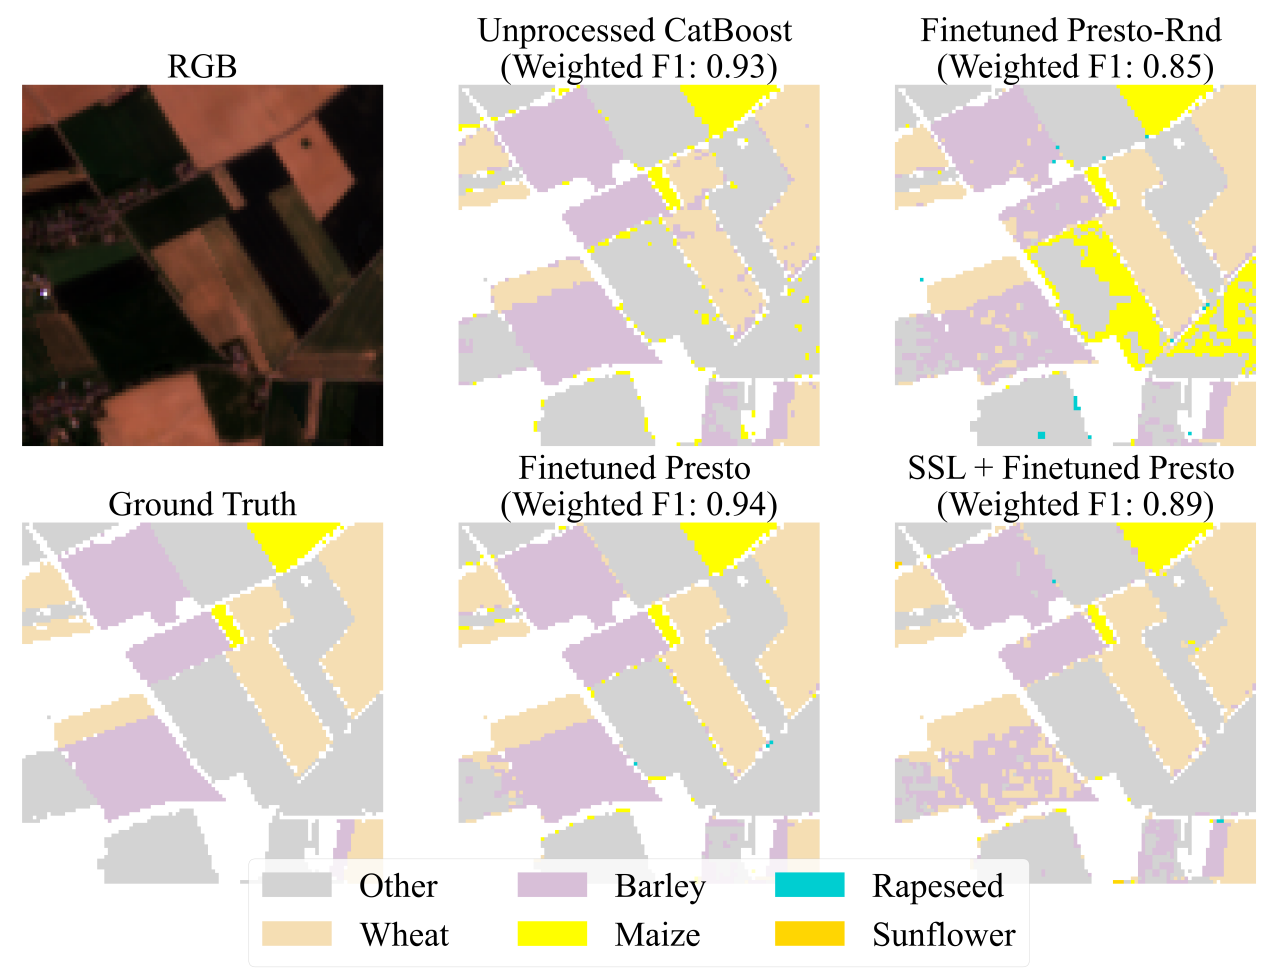
There’s been a flood of geospatial foundation models recently, each promising to change the way we do crop mapping, land cover classification, and environmental monitoring. In fact, I’ve covered them a lot in this newsletter. They do well on benchmarks, but very few are deployed in real systems. A new paper shows why. Benchmarks don’t capture messy, real-world factors like data heterogeneity, limited computing power, and the need to get something working quickly rather than perfectly.
The authors propose a structured three-step protocol:
Start by defining operational requirements,
Adapt the model to the domain, and
Run empirical tests that mimic the conditions you’d face in deployment.
They apply this to WorldCereal, the European Space Agency’s open global crop-mapping system. WorldCereal is designed to run on modest computing infrastructure and let users retrain models with their own data, so efficiency and adaptability were crucial.
For the case study, they used Presto, a lightweight transformer model pre-trained on global time series data. Fine-tuning Presto significantly outperformed the existing supervised baseline across both cropland and crop-type classification tasks, with strong generalisation across countries and years. Extra self-supervised steps didn’t add much, but the main lesson is pretty clear: pre-training matters, and careful alignment with operational needs makes these models practical for real-world mapping. I guess that all sounds pretty sensible…
Geospatial Datasets
1. Tropical cyclone wind-field dataset

There’s a new global high-res tropical cyclone wind-field dataset reconstructed from ERA5 using integrated parametric corrections. It’s validated against SMAP, WindSat, SFMR, and station data, showing improved maximum wind speeds, radius of maximum wind, and track representation for 1993–2022. You can access the data here and the code here.
2. City-level CO2 emissions dataset

This first city-level time-series compiles process-related CO₂ emissions for 289 Chinese cities (2000–2021) across 11 industrial products, using China-specific IPCC Tier-2 factors and missForest to fill gaps. It captures cement, crude steel, ammonia and more, with transparent inputs (139,876 records) and an uncertainty of about ±3.9%. You can access the data here and the code here.
3. Global 30m median vegetation maps

This new dataset provides global 30-m annual maps of median vegetation height from 2000–2022. It was built with ICESat-2 Lidar, Landsat imagery, and machine learning. Unlike earlier forest-focused products, it captures grasslands, savannas, tundra, and shrublands, offering better detail for ecosystems where short vegetation dominates. You can access the data here and the code here.
4. Global distribution projections

GridScopeRodents provides global ~10 km (1/12°) habitat-suitability projections for 10 rodent genera from 2021–2100, using MaxEnt with GBIF occurrences and WorldClim inputs across four SSP–RCP scenarios and 10 GCMs at 20-year steps. You can access the data here and the ArcGIS extension here.
Other useful bits
Geobase has released geoai.js, an open-source toolkit that lets developers run GeoAI models directly in the browser with WebGL/WebGPU. You can try out demos, docs, and code on GitHub, including a neat 3D visualisation of embeddings from drone imagery.
The Open Geospatial Carbon Registry (OGCR) has just launched. It aims to create an open, transparent, and farmer-friendly carbon registry for Europe. The registry is designed to support trustworthy carbon accounting by linking geospatial data with on-the-ground farming practices.

The SWOT satellite captured the leading edge of the tsunami triggered by an 8.8 magnitude earthquake off Russia’s Kamchatka Peninsula on 30 July. Its measurements of wave height, shape, and direction are helping NOAA refine tsunami forecast models, offering more accurate early warnings for coastal communities
.
A new NCAT5 video captures the sheer scale of today’s LEO and MEO constellations, showing how satellite broadband and direct-to-device connectivity are reshaping the industry. It’s a striking snapshot of how far satellite communications have come, and how quickly they’re accelerating.


Jobs
FAO is looking for a GIS Impact Assessment Specialist based in Rome.
First Street is looking for a Senior Data Scientist based in New York.
Mapbox is looking for a remote Technical Support Engineer based in the US.
Environmental Defense Fund (EDF) is looking for a Senior Analyst (Climate Resilient Water Systems) based in San Francisco.
Bridges to Prosperity is looking for a Geospatial Developer, with options to work Uganda, Rwanda, Zambia, Kenya, or Denver, Colorado.
Just for Fun

NASA’s James Webb Space Telescope has observed the interstellar comet 3I/ATLAS with its Near-Infrared Spectrograph.
That’s it for this week.
I’m always keen to hear from you, so please let me know if you have:
new geospatial datasets
newly published papers
geospatial job opportunities
and I’ll do my best to showcase them here.
Yohan