🌐 Quantifying the impact of floods on infant mortality
PLUS: Using multispectral data to measure poverty, evaluating aid programs from space, and more.
Hey guys, here’s this week’s edition of Spatial Edge — a weekly round-up of geospatial news that you can digest in less than 5 minutes a week. I recently found out on X that DOGE stands for the Department of Government Efficiency. I’m feeling a bit ripped off, as the only reason I decided to do a PhD is because I was told I could graduate from DOGE…
In today’s newsletter:
Linking floods to rising infant mortality
Poverty estimates using multispectral imagery
Evaluating aid programs with remote sensing data
Independent reviews in aid project success metrics
Agricultural field boundary dataset for the globe
Research you should know about
1. Quantifying the impact of floods on infant mortality
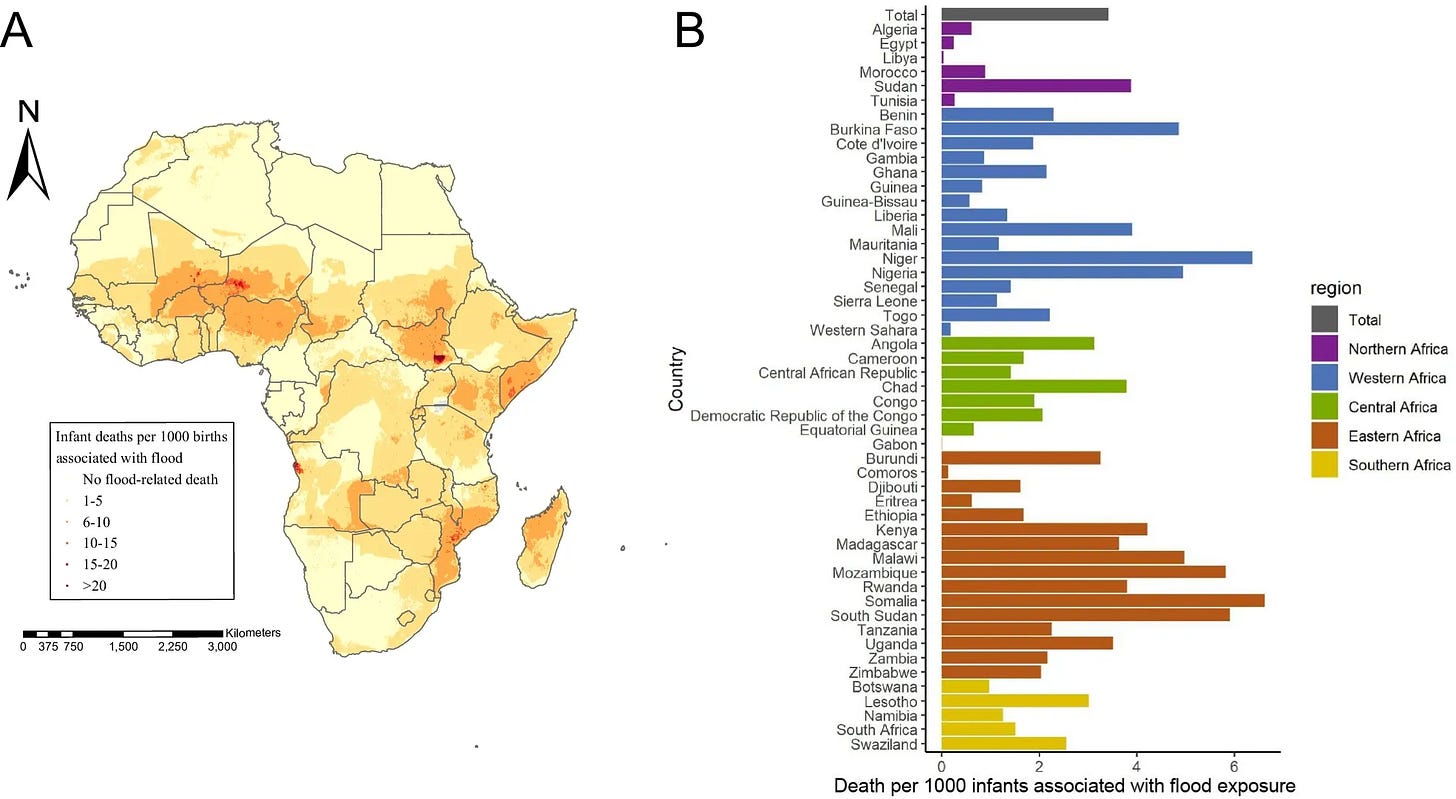
A new study in Nature Communications examines how flood exposure is linked to higher rates of infant mortality in 37 African countries.
The team looked at data from over 514,000 newborns from Demographic and Health Surveys between 1990 and 2020. They matched each infant’s birthplace coordinates with flood records from the Dartmouth Flood Observatory and compared infants who didn’t survive their first year with siblings who did.
By using a case-control approach and statistical methods that estimate odds ratios (a way to measure how the likelihood of death changes when exposed to floods), they linked household-level flood exposure during different time periods—ranging from a month to several years—to subsequent infant deaths.
They found that flood exposure was associated with about 3.42 extra infant deaths per 1000 births during 2000–2020. This is roughly 1.7 times higher than estimates that looked only at immediate flood effects. The risk persisted for up to four years after the flood, and more severe floods led to greater losses.
2. Using multispectral data to estimate poverty
New research from Oxford and the National University of Singapore explores how combining multiple spectral bands of satellite imagery can improve estimates of socio-economic indicators. This addresses a key challenge: traditional methods often rely on visible (RGB) imagery alone, missing important details in other bands that might be relevant for poverty mapping and related measures.
The researchers used Sentinel-2 imagery, grouped into different three-band combinations, and fed each combination into pre-trained vision models (transformers) to extract features. They worked with the KidSat dataset, which links satellite imagery to child poverty estimates across 16 African countries, and applied Bayesian regression methods that provide both a prediction and a measure of uncertainty. By using this multi-spectral approach, they captured subtle differences in vegetation, water content, and built environments, and combined the extracted features into a single representation before predicting poverty levels.
Their results showed improved accuracy over existing models that rely on fewer bands or unstructured spectral inputs (a MAE of 0.2930 for RGB vs a MAE of 0.1605 using their approach). They also demonstrated that Bayesian linear regression outperformed a heteroscedastic model in uncertainty estimation.
Anyway, this is a nice extension to some of the other studies I’ve discussed that use remote sensing data to estimate wealth and poverty.
3. Assessing programme impact with remotely sensed data
A new paper from researchers at Harvard and MIT presents a new way to evaluate policy and development programs using remote sensing data (instead of relying on surveys). This addresses a pretty big problem we face in the international development space — ground-truth data on outcomes like income or environmental quality can be expensive and tough to collect.
To avoid bias, the authors took a bit of a different route from simply predicting outcomes from satellite images and then using these predictions as if they were observed data. Instead, they use observational data—where both the true outcome and remotely sensed variables (RSVs) are known—to learn a stable relationship between outcomes, treatment, and RSVs. Rather than plugging RSV-based predictions straight into the analysis, they construct a set of conditional moment conditions that directly link what they observe in both samples. By using these conditions, they form an “instrument-like” representation of the RSV that measures the true treatment effect.
They applied their method to re-evaluate a large-scale public employment programme in India. By using their approach, they showed that the differences originally measured through on-the-ground data collection—such as improvements in local consumption levels—could be closely matched using only the remotely sensed data.
4. How to better evaluate the success of aid projects
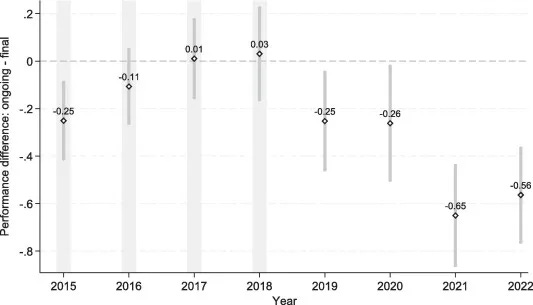
A new study in World Development investigates how making aid project evaluations more independent affects reported performance outcomes. The researchers analysed Australian aid project assessments before and after a 2019 change that introduced external reviews by independent contractors for completed projects.
They used a difference-in-differences approach to compare assessments of ongoing projects (which continued with internal evaluations) and completed projects (which underwent the new external review process). The data included performance ratings on effectiveness and efficiency from 2014 to 2022. The findings showed that after implementing external reviews, reported success rates of aid projects significantly decreased. This suggests that internal evaluations may have been overly optimistic due to biases or incentives within the aid agency (no surprises here I guess).
Geospatial datasets
1. Fields of the world dataset
The Fields of The World (FTW) dataset is a globally diverse collection of over 1.6 million agricultural field boundaries from 24 countries across four continents. The latest update was released a couple of months ago. You can access the data here and the code here.
2. Planted forest timber dataset
The Planted Forest Timber Data (PFTD) tracks over 700 timber species from planted and natural forests across 91 countries. You can access the code here.
3. Temperature exceedance dataset
A new study in Scientific Data breaks down global emissions scenarios into detailed, area-specific temperature projections. You can access the data here. You can also access the code for the MESMER and FaIR emulators.
4. Daily meteorological dataset
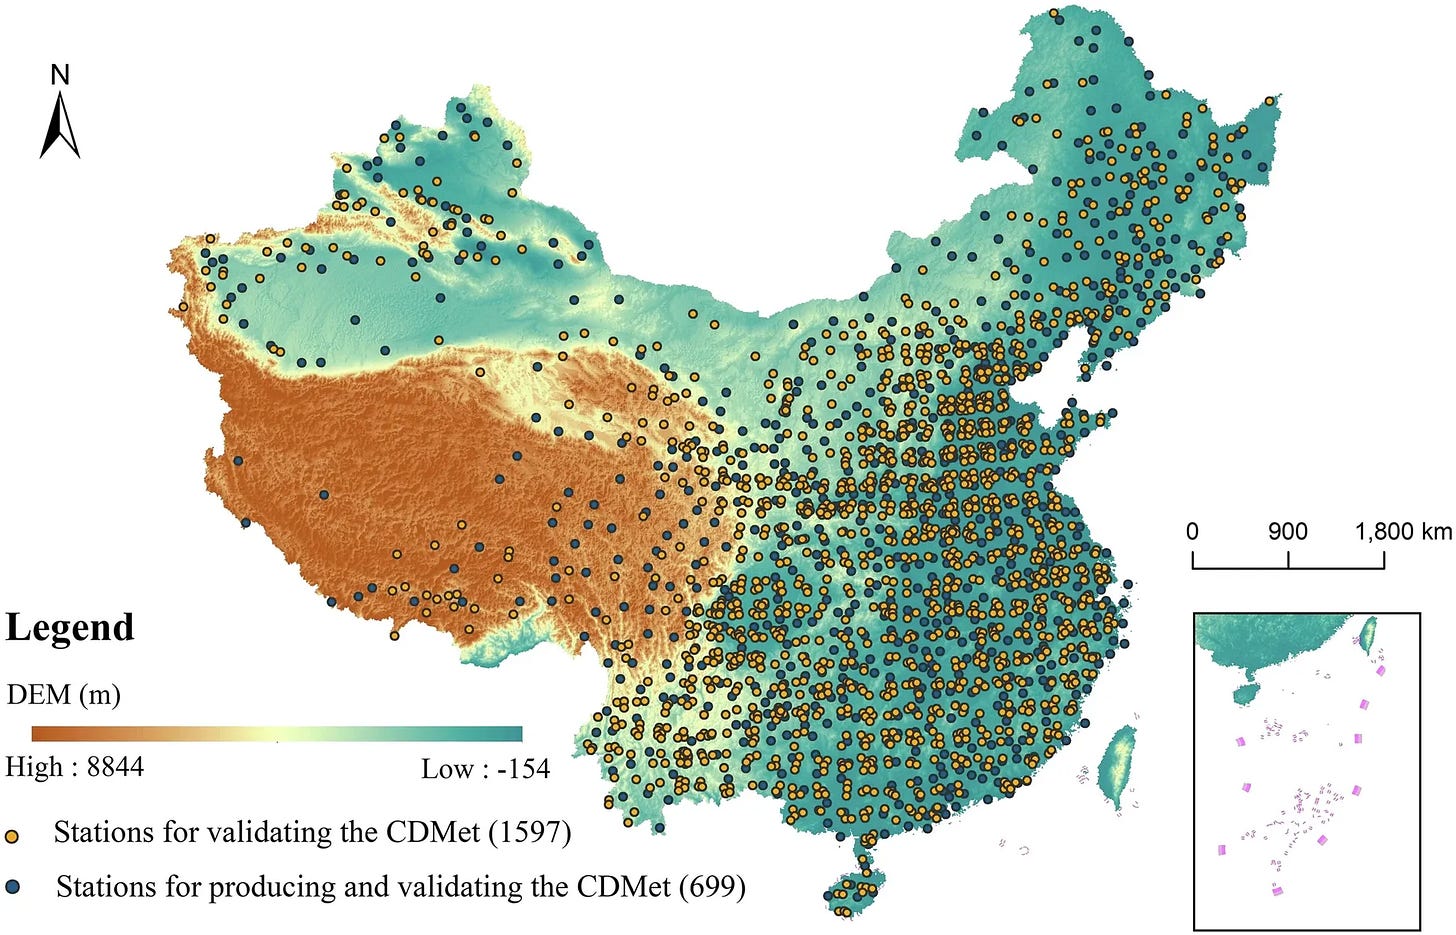
The China Daily Meteorological Dataset (CDMet) provides detailed daily weather data for mainland China from 2000 to 2020, covering nine key variables like temperature and precipitation. It’s built using data from 699 weather stations and is available at a spatial resolution of 4 km. You can access the data here and the code here.
Other useful bits
Check out Global Data Lab’s Subnational Gender Development Index (SGDI), which was released for the Elimination of Violence against Women (on 25 November).
Eurostat has introduced experimental geospatial data from the 2020 agricultural census, providing detailed maps on farm numbers, livestock density, and farmer demographics.
Wherobots has raised $21.5 million in Series A funding to improve geospatial and climate intelligence using AWS Cloud. Their platform enables rapid geospatial data processing, supporting industries such as insurance, agriculture, and logistics.
A recent paper in SoftwareX introduces a “streetscape” package in R, providing a reproducible way to analyse open-source street view datasets.
Google Research has introduced the Population Dynamics Foundation Model, using graph neural networks to help address geospatial problems across health, socioeconomics and environmental topics.
Cuvis.ai is an open-source, low-code tool designed to simplify working with hyperspectral data, from acquisition and preprocessing to model training. Built in Python, it supports both classical and deep learning models. You can access the code and data via Github.
Jobs
Geoscience Australia is looking for a Manager for Earth Observation Data Calibration and Validation, who will be part of its Research and Product Delivery directorate within the Digital Earth (DE) Branch.
Innoflair is looking for a Marine Earth Observation Operational Support Specialist to work on projects for their client, EUMETSAT.
Umbra is looking for a Director of Product, Remote Sensing who will be at the forefront of developing innovative SAR-based products and solutions.
Everbridge is looking for a Geospatial Insights Analyst with a strong software development and GIS background.
Aarhus University in Denmark is looking for a Professor in Remote Sensing and GIS for Atmospheric Emission Monitoring and Modelling.
Just for Fun
Niantic, the developer of Pokémon Go, is creating a ‘Large Geospatial Model’ (LGM) using millions of real-world images collected from players of its games and users of its Scaniverse app. This AI model aims to improve computers' and robots' understanding of physical spaces. This could help improve stuff like augmented reality, robotics, and autonomous systems.
That’s it for this week.
I’m always keen to hear from you, so please let me know if you have:
new geospatial datasets
newly published papers
geospatial job opportunities
and I’ll do my best to showcase them here.


