


Hey guys, here’s this week’s edition of the Spatial Edge. We’re like the geospatial newsletter equivalent of Gemini - we used to be cool last year, but we’re slightly less cool with each passing month... In any case, the aim is to make you a better geospatial data scientist in less than five minutes a week.
In today’s newsletter:
Population Mapping: Foundation models improve population estimates in data-poor regions.
Annotation-Free AI: Self-training model eliminates manual geospatial labels.
Mobility Modelling: Hierarchical approach accelerates large-scale movement simulations.
Foundation Models: Audit exposes major benchmarking and reproducibility issues.
Settlement Data: Global 10 metre settlement dynamics dataset released.
Research you should know about
1. Rethinking population mapping with foundation models
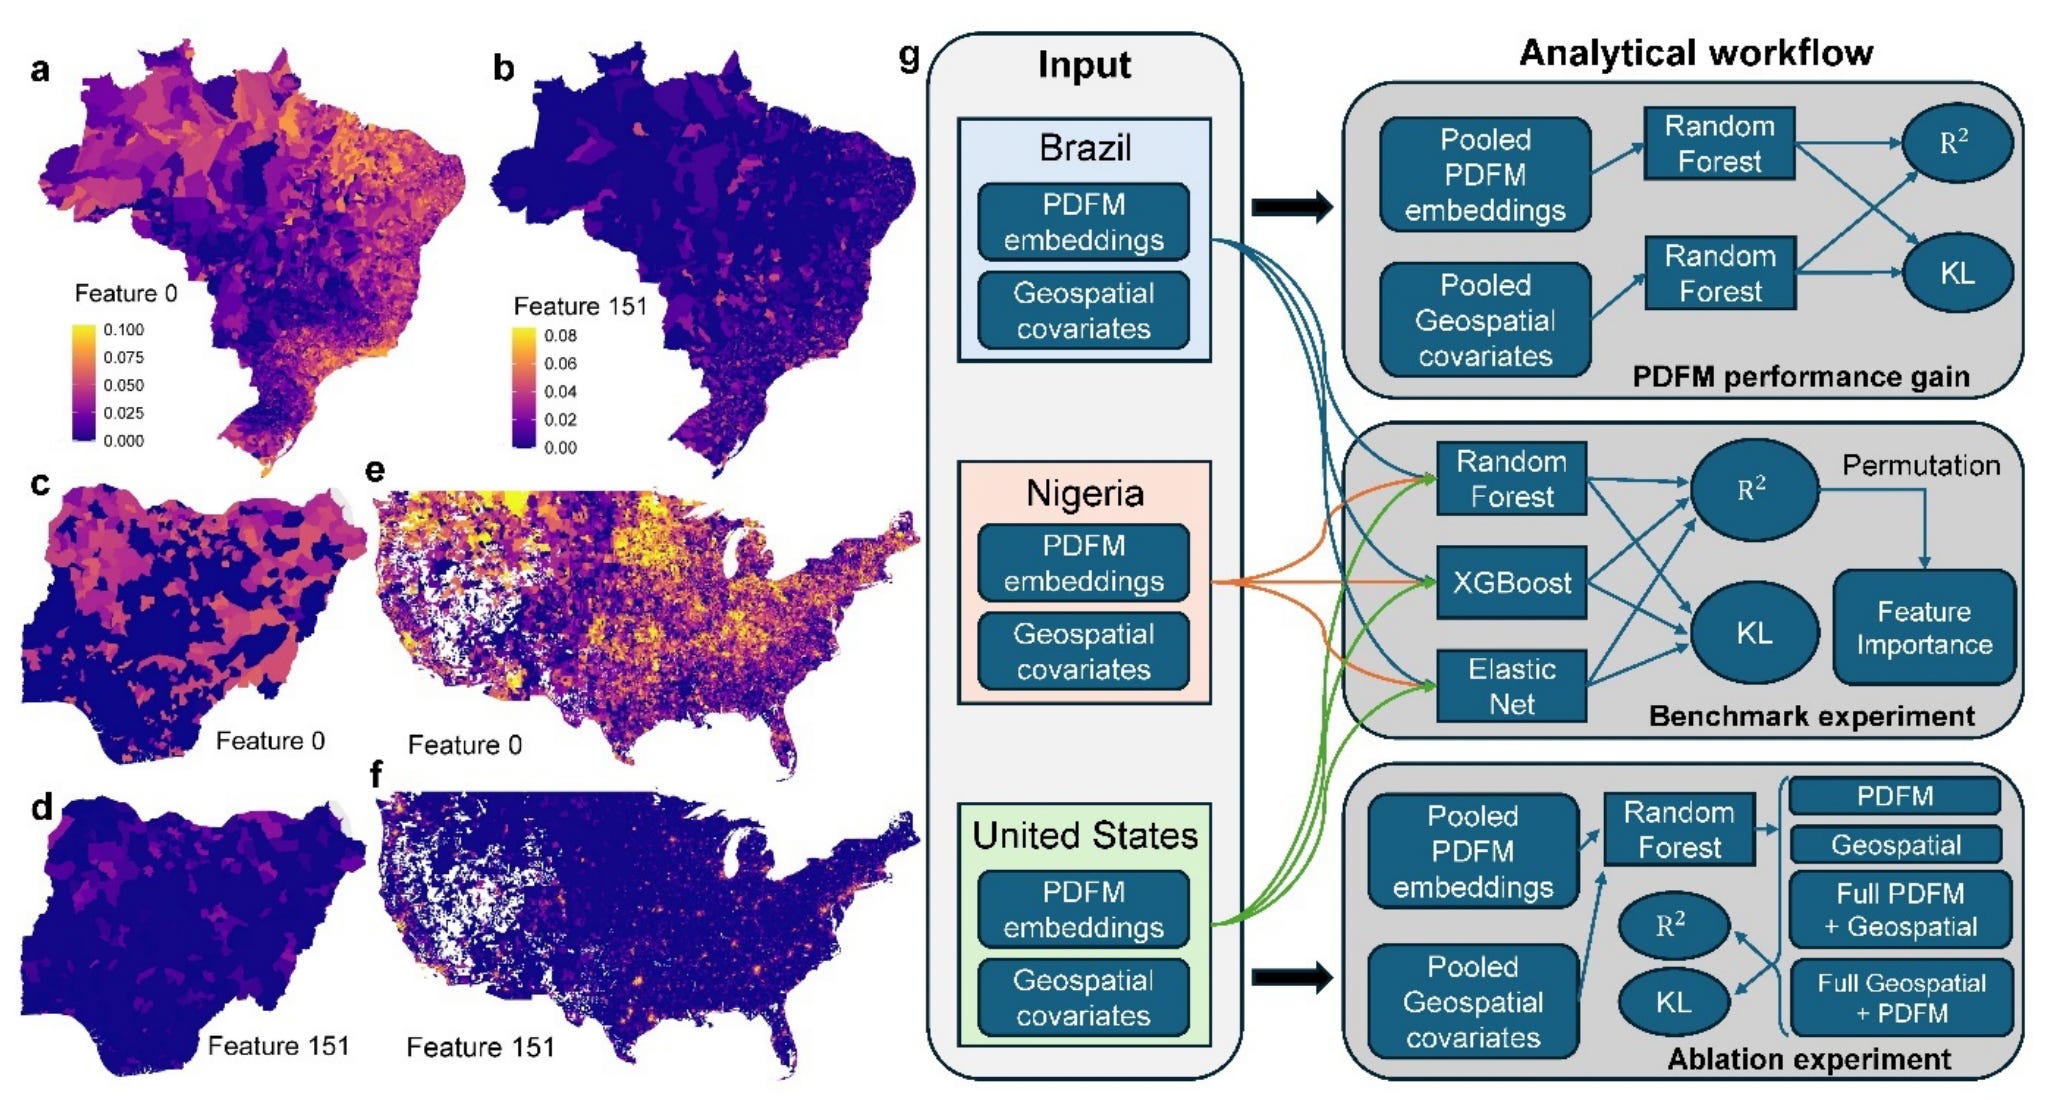
When planning infrastructure or responding to disasters, having accurate, up-to-date population estimates is obviously pretty important. However, as anyone who’s used survey data before, it can be outdated or spatially imprecise, especially in rapidly developing countries. Traditionally, demographers have filled these gaps by estimating populations using a bunch of hand-picked geospatial covariates like satellite imagery of nighttime lights, road networks, and building density. While effective, assembling these datasets is a pain. A new paper tests whether we can skip the manual assembly and instead use the Population Dynamics Foundation Model (PDFM). This model generates embeddings by compressing a bunch of different data, such as search trends, maps, and local activity levels, into a single, reusable mathematical representation of a place (btw, I did a deep dive on embeddings here).
To benchmark this, the researchers compared the predictive power of PDFM embeddings against 23 standard geospatial covariates for estimating subnational populations in Brazil, Nigeria, and the United States. They found that PDFM successfully improved predictive fit, reducing unexplained variance by a median of 20.1% across various machine learning models. However, the performance was pretty uneven. PDFM provided the biggest boost in large, less-developed regions where traditional markers like building density and road networks were weak or absent. In highly developed areas where traditional covariates already captured settlement patterns perfectly, PDFM added very little value.
The study also uncovered a major limitation regarding scale. While PDFM embeddings were highly accurate at the specific spatial resolution they were trained for (e.g., zip codes), their performance broke down predictably when the researchers attempted to aggregate them to larger areas like counties. In contrast, standard geospatial covariates proved much more flexible across different spatial scales. The researchers conclude that while embeddings are useful tools for data-poor environments, they shouldn’t outright replace traditional methods. Instead, the future of population modelling likely lies in hybrid approaches that combine the nuanced, human-activity signals of embeddings with physical geospatial covariates.
2. Eliminating manual annotations for geospatial reasoning
Geospatial reasoning (or I guess any reasoning for that matter) requires models to understand fuzzy, abstract user queries and map them to precise physical locations, like finding the best area to set up emergency shelters after an earthquake. Recent advances in Multimodal Large Language Models (MLLMs) have made it possible for AI to autonomously generate the logical steps to answer these queries. However, the big issue is that teaching these models to actually output the correct geographic coordinates still requires massive amounts of human-annotated bounding boxes. This reliance on labels prevents these models from freely learning and self-evolving using the petabytes of unlabelled satellite imagery currently available.
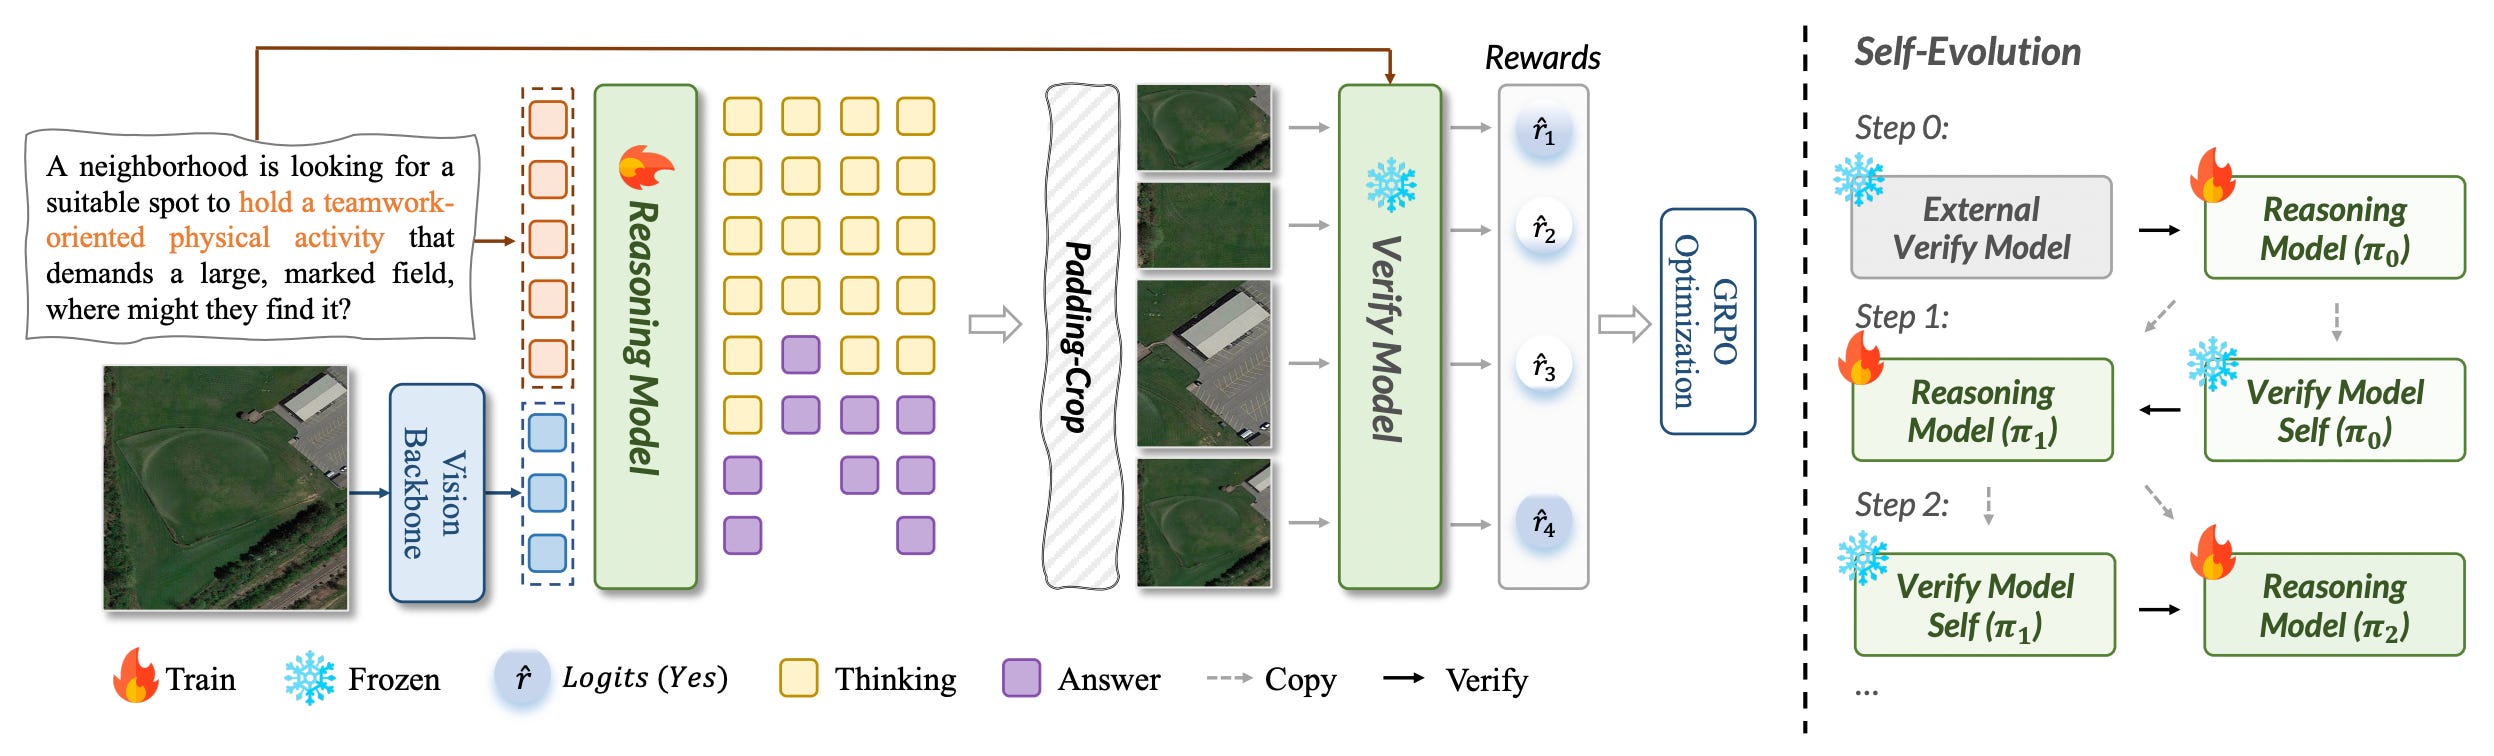
To address this, a new study introduces RemoteZero, a training framework that requires absolutely zero human bounding-box annotations. The researchers noticed that MLLMs are much better at verifying if a given cropped image matches a text description (the “Eye”) than they are at generating raw coordinates from scratch (the “Hand”). So, RemoteZero uses a “Generate-Crop-Verify” loop. The model basicaly guesses a location, crops that area from the image, and then uses a verifier to check if the crop semantically matches the query. This semantic yes/no score is then fed back into the model as a reward using Group Relative Policy Optimization (GRPO), teaching it to find the right locations without ever seeing a human label.
Interestingly, RemoteZero enables the model to teach itself. Instead of relying on a larger, external model to act as the verifier, RemoteZero can use its own frozen policy from a previous training round to verify its current guesses, creating a continuous loop of self-evolution. When tested against fully supervised baselines that rely on thousands of manual annotations, the self-evolving RemoteZero model actually outperformed them, scoring 71.29% accuracy on the EarthReason benchmark. This proves that intrinsic semantic verification is a viable path forward, potentially unlocking the ability to train powerful geospatial AI using entirely unlabelled satellite data.
3. A smarter way to model mobility
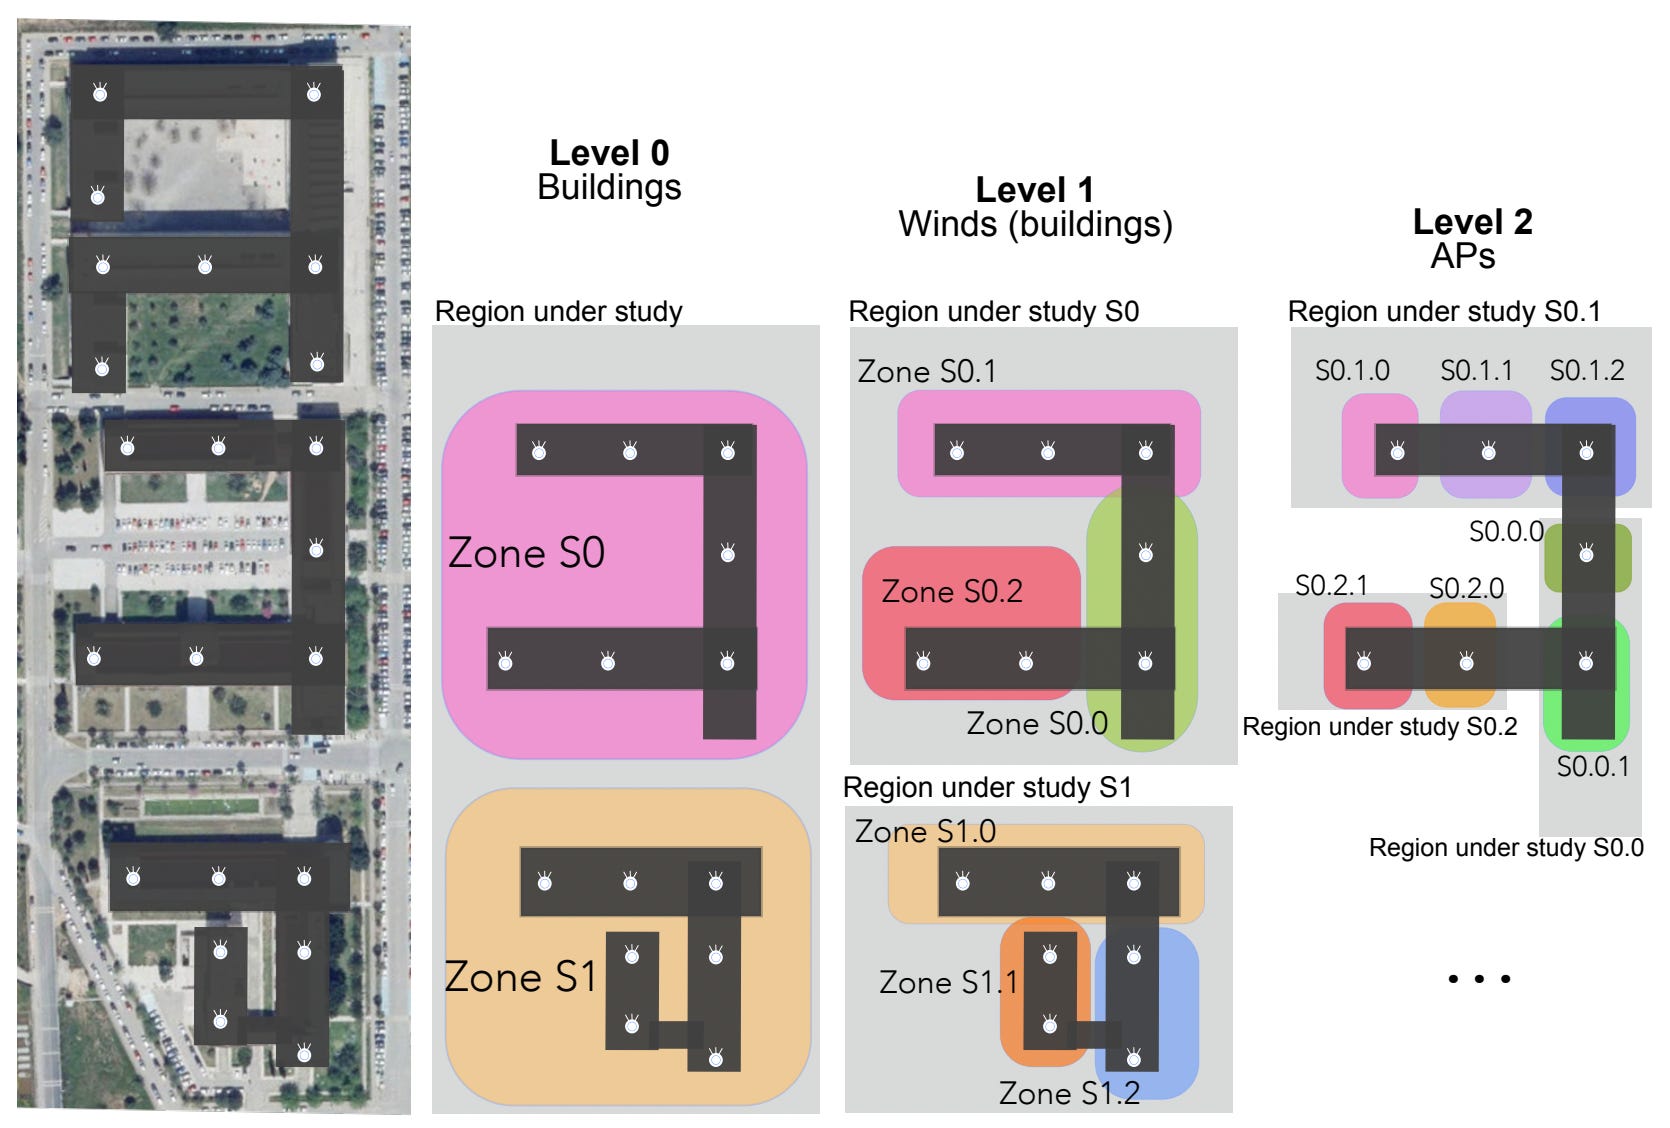
Simulating how users move around in large-scale networks, like fog computing environments, can be pretty difficult without good real-world data. When researchers try to build mobility models from scratch, they often run into massive computational bottlenecks because tracking every single access point in a large area is overwhelming. A new study tackles this issue by proposing a hierarchical method that groups Wi-Fi access points based on their geospatial features. Rather than treating every access point as an isolated spot, they’ve organised them into nested levels, such as moving from an entire building down to a specific wing, then a floor, and finally the individual access point. This top-down approach means it’s a lot easier to track user trajectories and simulate realistic movement without getting bogged down by the sheer volume of network data.
The team analysed wireless access logs from the University of the Balearic Islands campus, using tracking data from the Aruba Location Engine. By applying clustering algorithms to profile user behaviour at different granularities, they generated transition matrices that accurately mapped out where people were likely to go next. The results were pretty impressive. Compared to flat, non-hierarchical models, they layered approach massively reduced the computational complexity. It actually slashed the execution time needed for clustering from several hours down to just a few minutes, while drastically cutting the optimal number of clusters required.
4. The messy state of geospatial foundation models
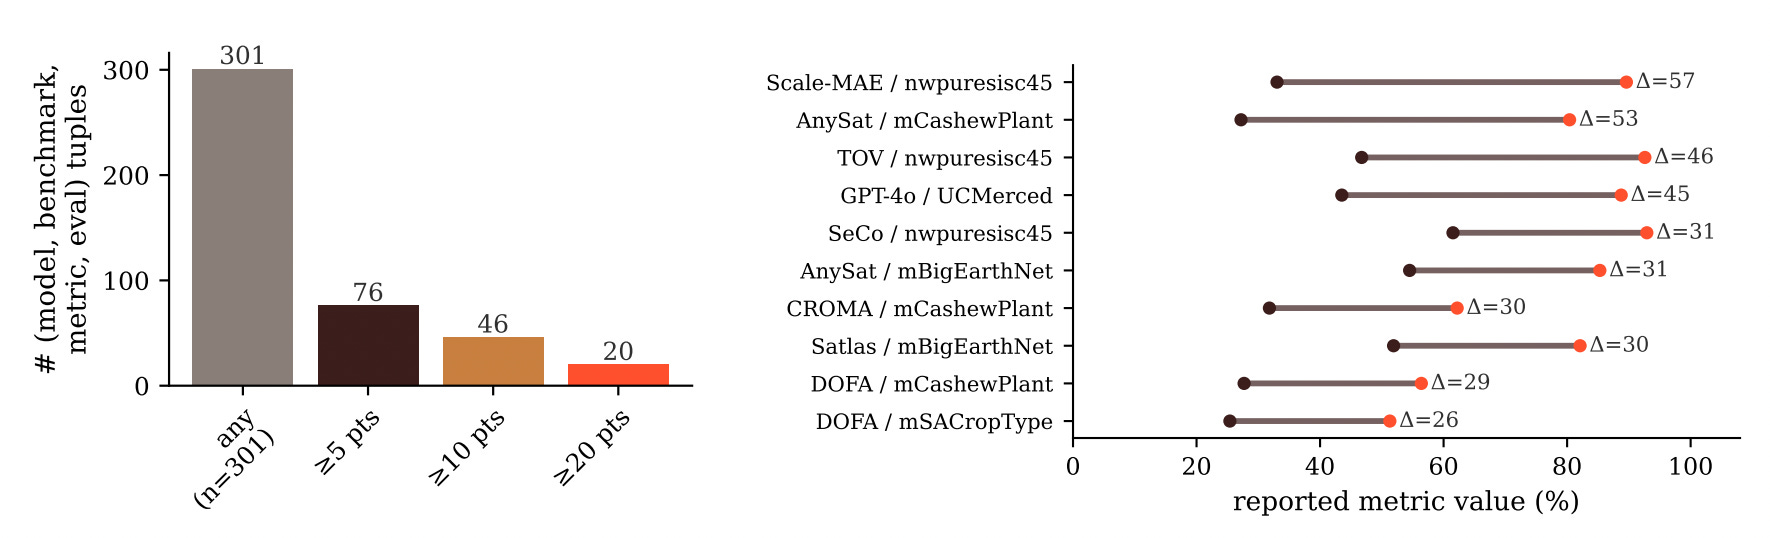
I know, I know. Another Spatial Edge newsletter, another foundation model paper… But as long time readers may know, I’m still a bit skeptical about how useful they are (more info on this here). But a massive audit of 152 papers reveals a pretty big problem, which is that nobody actually knows what the state of the art is. The researchers found that the current literature is a bit of a mess when it comes to standardising evaluations and testing protocols. E.g. they documented 46 cases where different papers reported wildly different scores (sometimes off by tens of points) for the exact same model and benchmark. Without shared controls or a common evaluation harness, comparing these models is nearly impossible.
The issues go deeper than just mixed-up scorecards though. The audit discovered that 39% of papers do not even release their model weights 🤯. On top of that, researchers are frequently tweaking both the model architecture and the pretraining data at the same time without isolating the variables. This means when a new model claims a massive leap in accuracy, you can’t really tell if the improvement came from a new design or just a massive new dataset. It creates a confusing environment where weak models can hide behind massive datasets, and actual architectural progress gets lost in the noise.
Geospatial Datasets
1. Global settlement exposure dataset
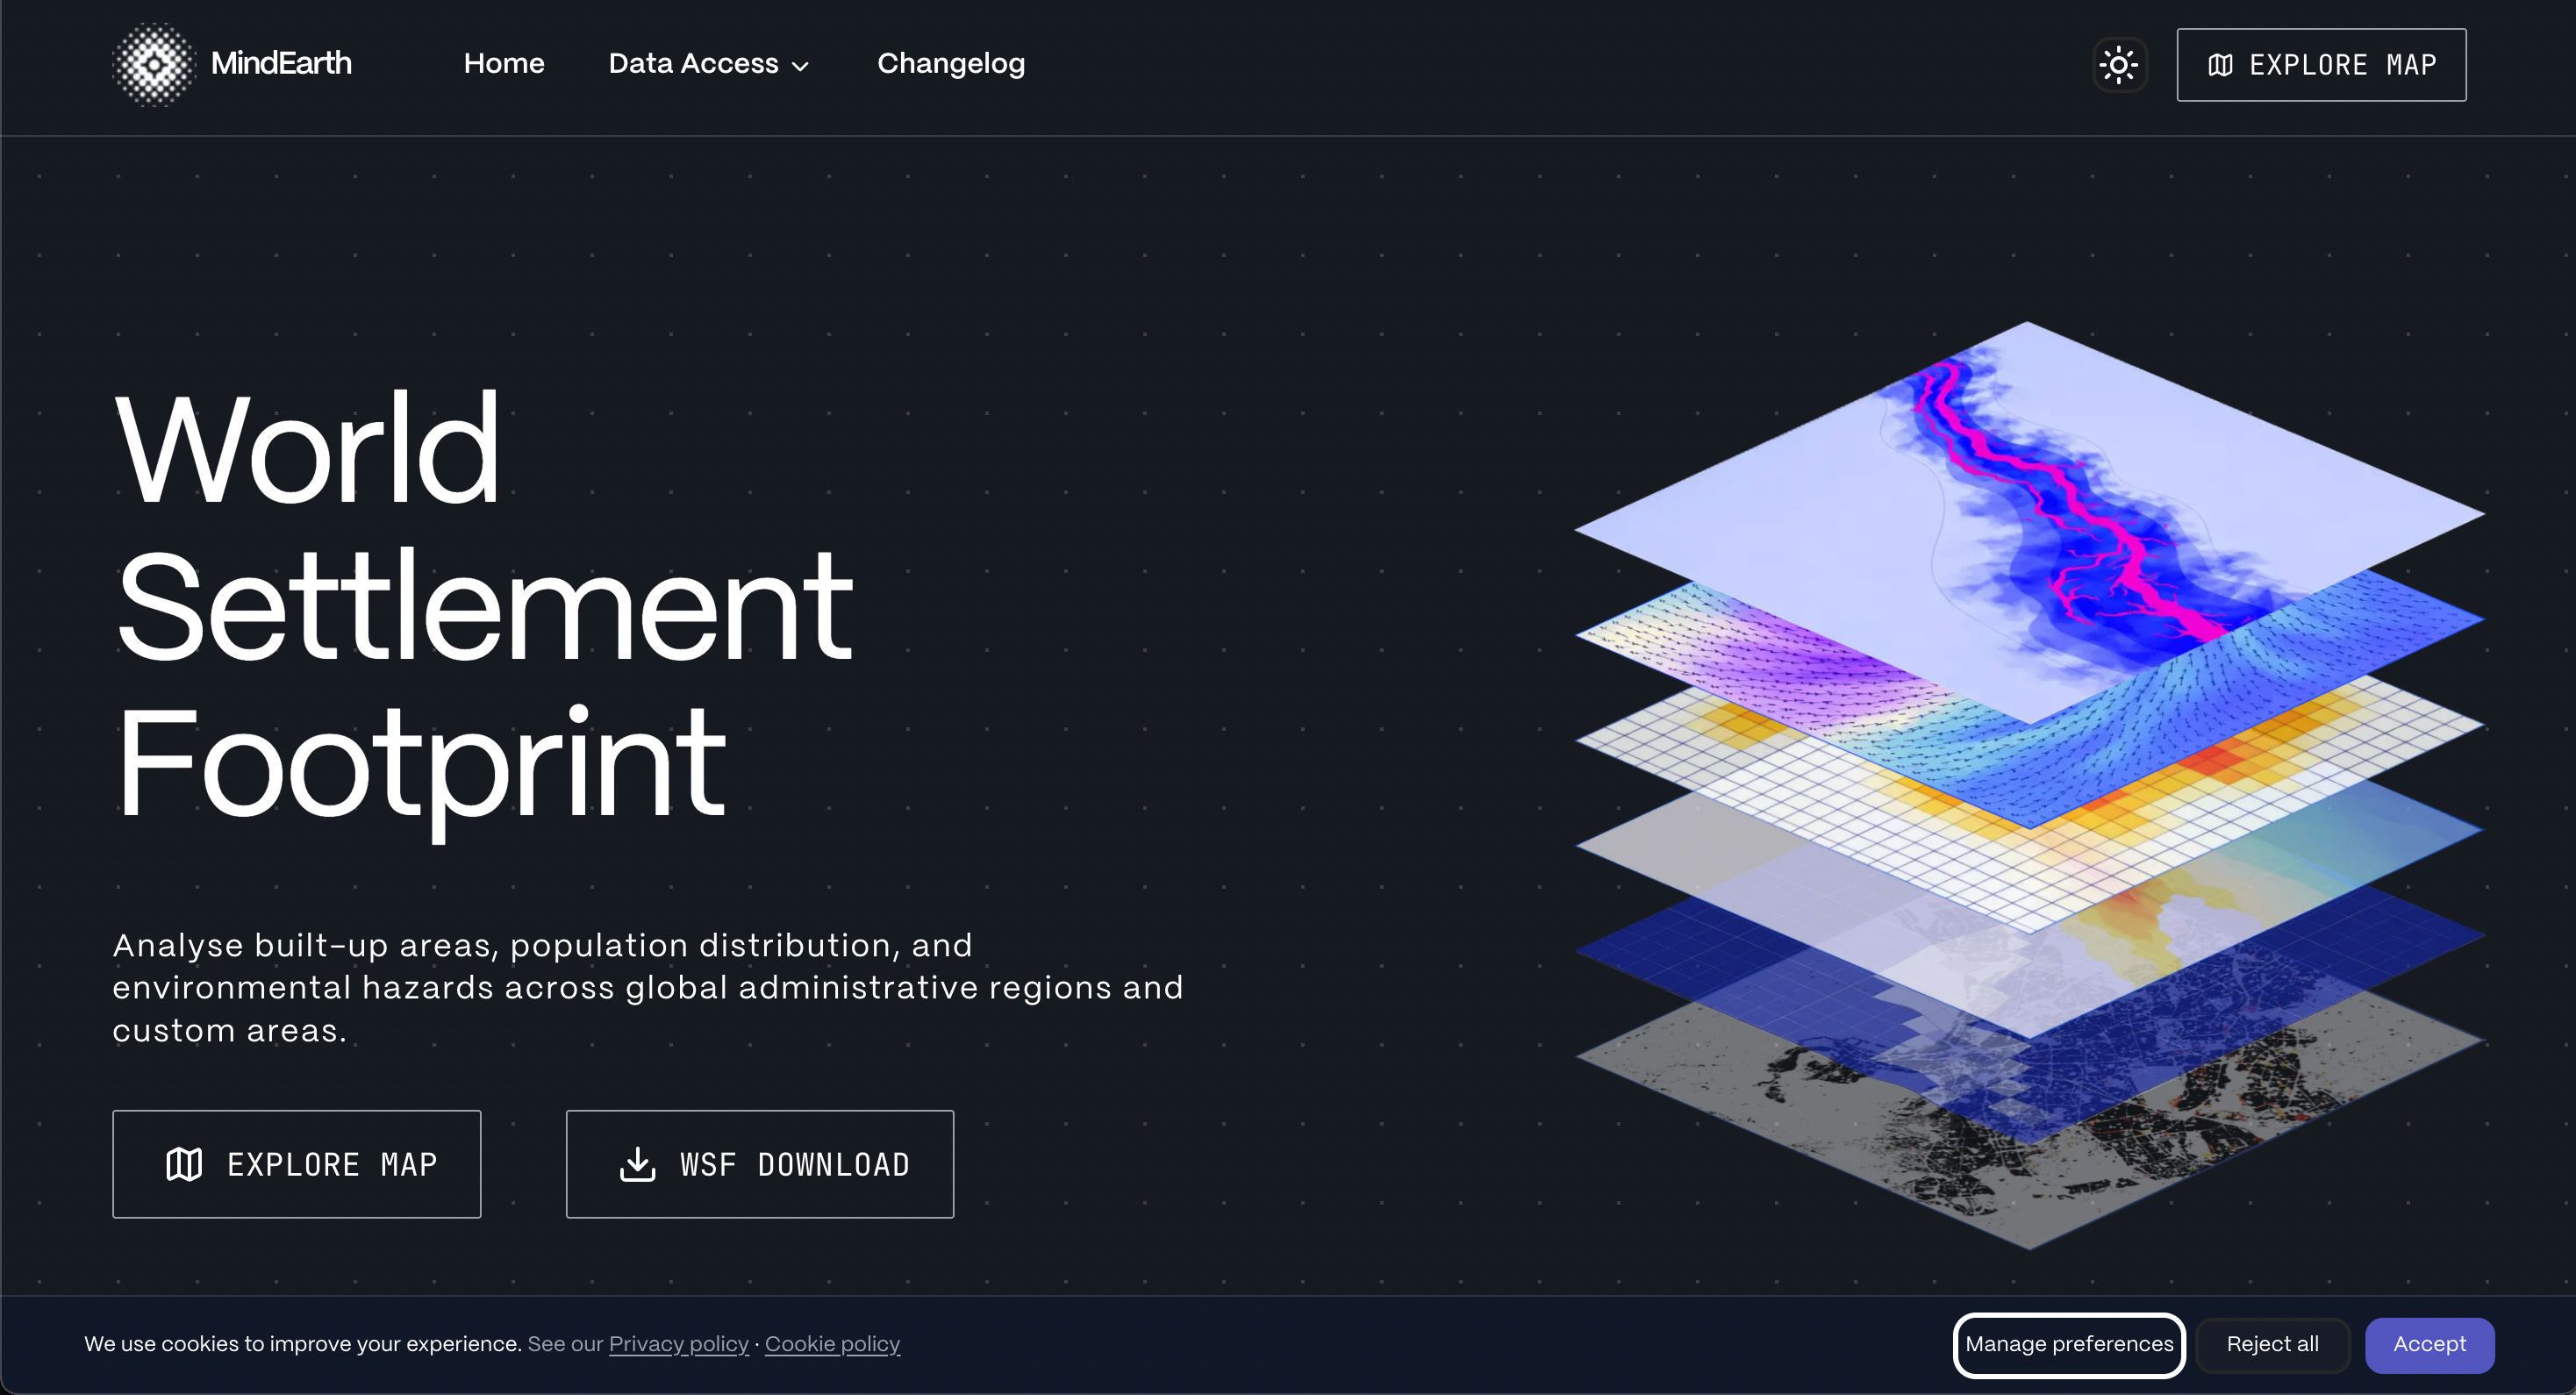
The World Settlement Footprint dataset provides global 10-m resolution settlement dynamics published as a cloud-native GeoZarr layer. Access the data here and the platform here.
2. Urban rooftop reflectivity dataset
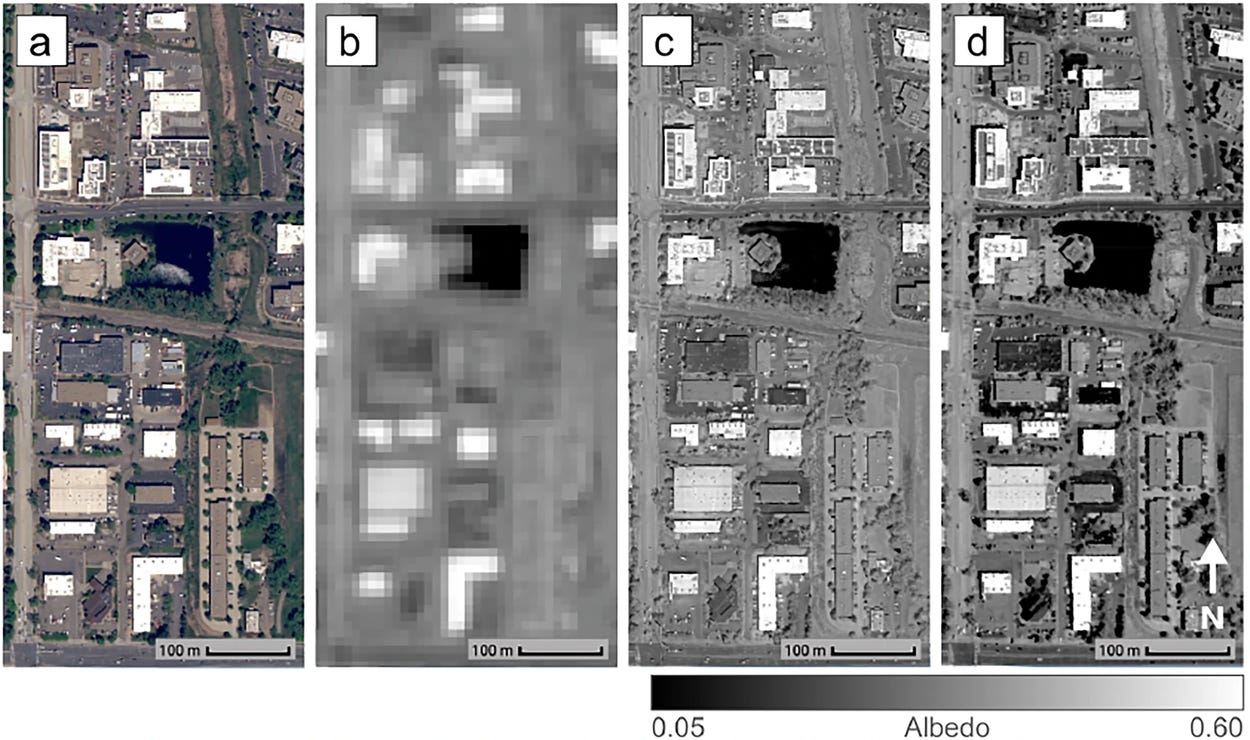
The Heat Resilience dataset provides high-resolution, building-level rooftop reflectivity data across more than 50 global cities to support urban heat mitigation. Produced by fusing 10-metre Sentinel-2 satellite observations with 30-centimetre commercial satellite imagery, the model reconstructs granular albedo profiles for individual structures. Access the data and documentation here.
3. Small-area global election returns dataset
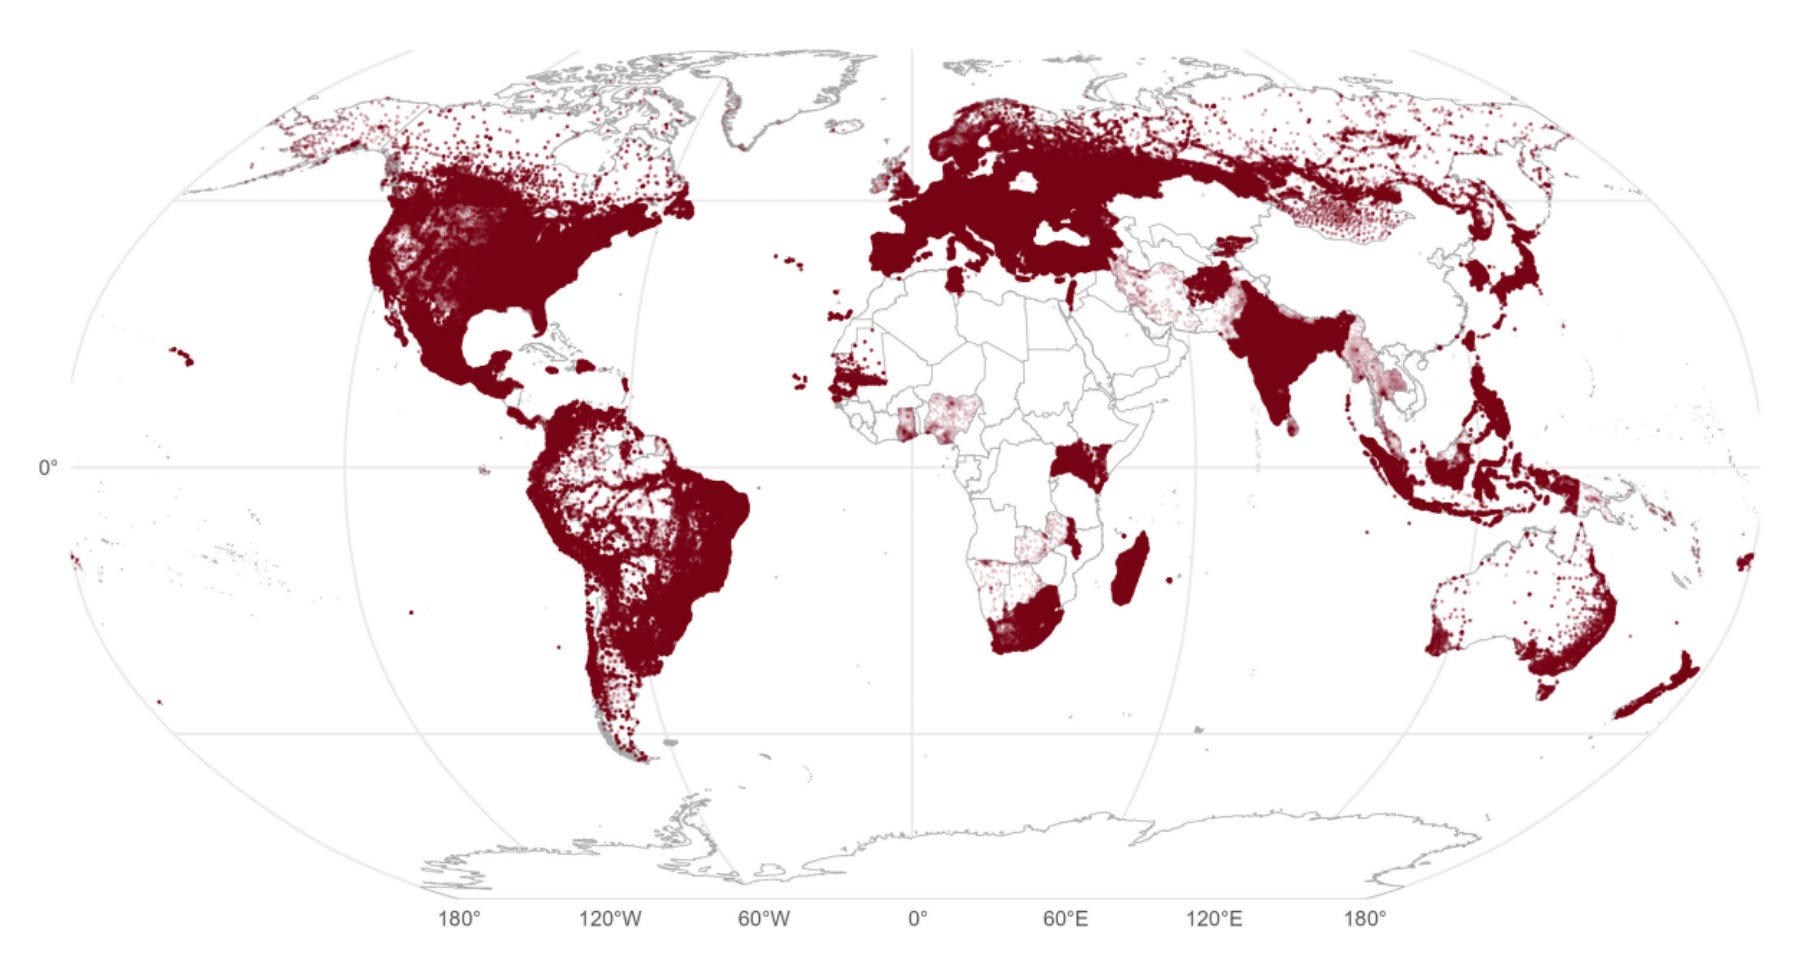
The Small-Area Global Elections (SAGE) dataset compiles lower-house parliamentary and presidential election returns for 110 countries at the smallest unit published by local electoral authorities. The repository contains roughly ten billion votes across more than eight million geocoded units, with candidate and political party identifiers harmonised across multiple languages. Access the data here and the code here.
Other useful bits
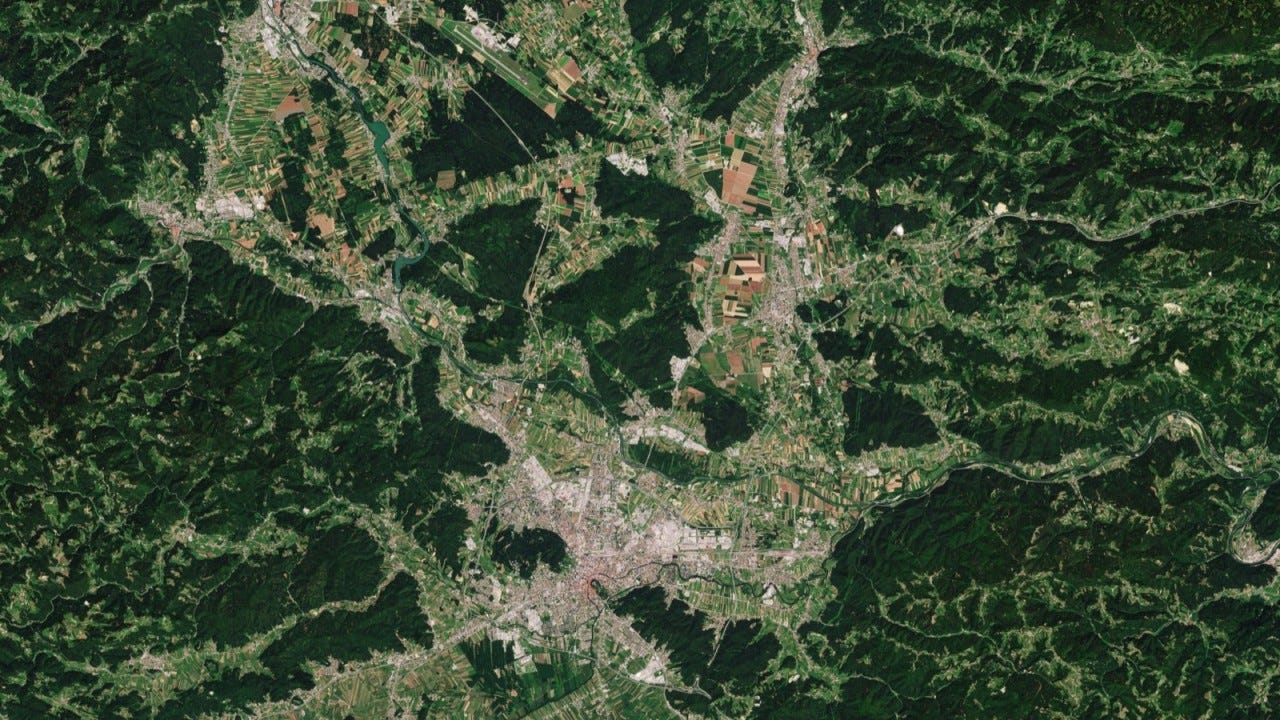
I really loved this article from Bruno Sanchez. He argues that Europe consistently loses its home-grown space innovations to foreign buyers because public funding focuses on de-risking supply rather than de-risking market demand. To bridge the downstream investment gap, ESA must act as a committed anchor customer through fixed-price contracts that de-risk future commercial demand and keep scaling companies rooted in Europe.
SkyFi has launched SkyFi for ArcGIS, bringing on-demand satellite imagery directly into Esri workflows via a native Experience Builder widget and live WMTS streaming. The integration allows users to search archives, task satellites, and stream map layers across ArcGIS platforms without switching applications or manually downloading files.
The 2026–2027 World Bank Country Income Classifications reveal that six countries advanced to higher income categories through different economic mechanisms, including export-led expansion, broad-based domestic growth, and recovery from financial crisis. Non-growth factors such as statistical revisions to national accounts and downward population census adjustments also played decisive roles in pushing certain economies past the per-capita income thresholds.
UNESCO has launched an open-learning course on Flood Hazard and Exposure Mapping to train participants in flood modeling, risk assessment, and exposure analysis. Featuring hands-on exercises and real-world case studies from Mozambique, the program equips learners to evaluate urban, coastal, and riverine flood impacts for informed decision-making.
Jobs
Arsenal FC is looking for a Research Engineer under their Data Analytics team.
The World Bank is looking for a Data Scientist (Consultant) based in Washington.
WSC is looking for a remote Data Management Specialist based in Canada.
UNDP is looking for a Data Assistant based in Rio de Janeiro.
Esri Netherlands is looking for an Analytics Consultant based in Rotterdam.
Just for Fun
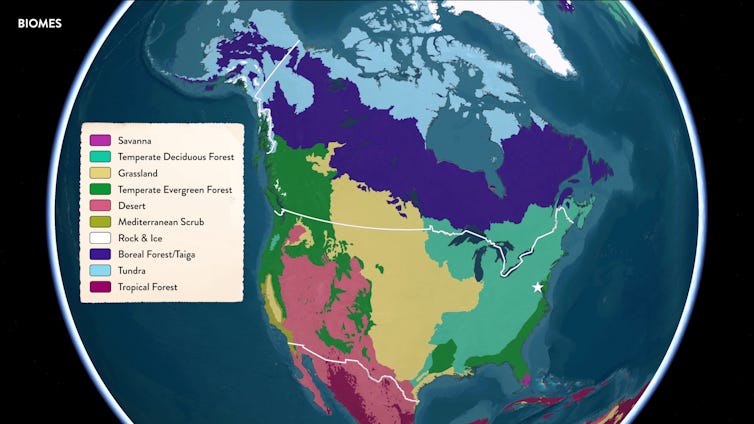
A new Smithsonian exhibition marks the US 250th anniversary by mapping the country through its natural contours, such as watersheds, biomes, and fossil beds.
That’s it for this week.
I’m always keen to hear from you, so please let me know if you have:
new geospatial datasets
newly published papers
geospatial job opportunities
and I’ll do my best to showcase them here.
Yohan