

🌐 Turns out Google’s satellite data needs a text upgrade
PLUS: A new framework for mapping healthcare demand, the impact of wildfire smoke, and more.

Hey guys, here’s this week’s edition of the Spatial Edge a newsletter that has as many fans as a multispectral image has bands… In any case, the aim is to make you a better geospatial data scientist in less than five minutes a week.
In today’s newsletter:
Urban Mapping: AI blends text and satellite data for better insights.
Healthcare Planning: AI optimiser improves hospital placement and reduces travel times.
Irrigation Risks: Water use cools air but increases dangerous humid heat.
Smoke Impacts: Wildfire particulates raise heart and neurological risks in children.
Population Data: New dataset offers global population projections through 2100.
Research you should know about
1. Teaching AlphaEarth to understand cities
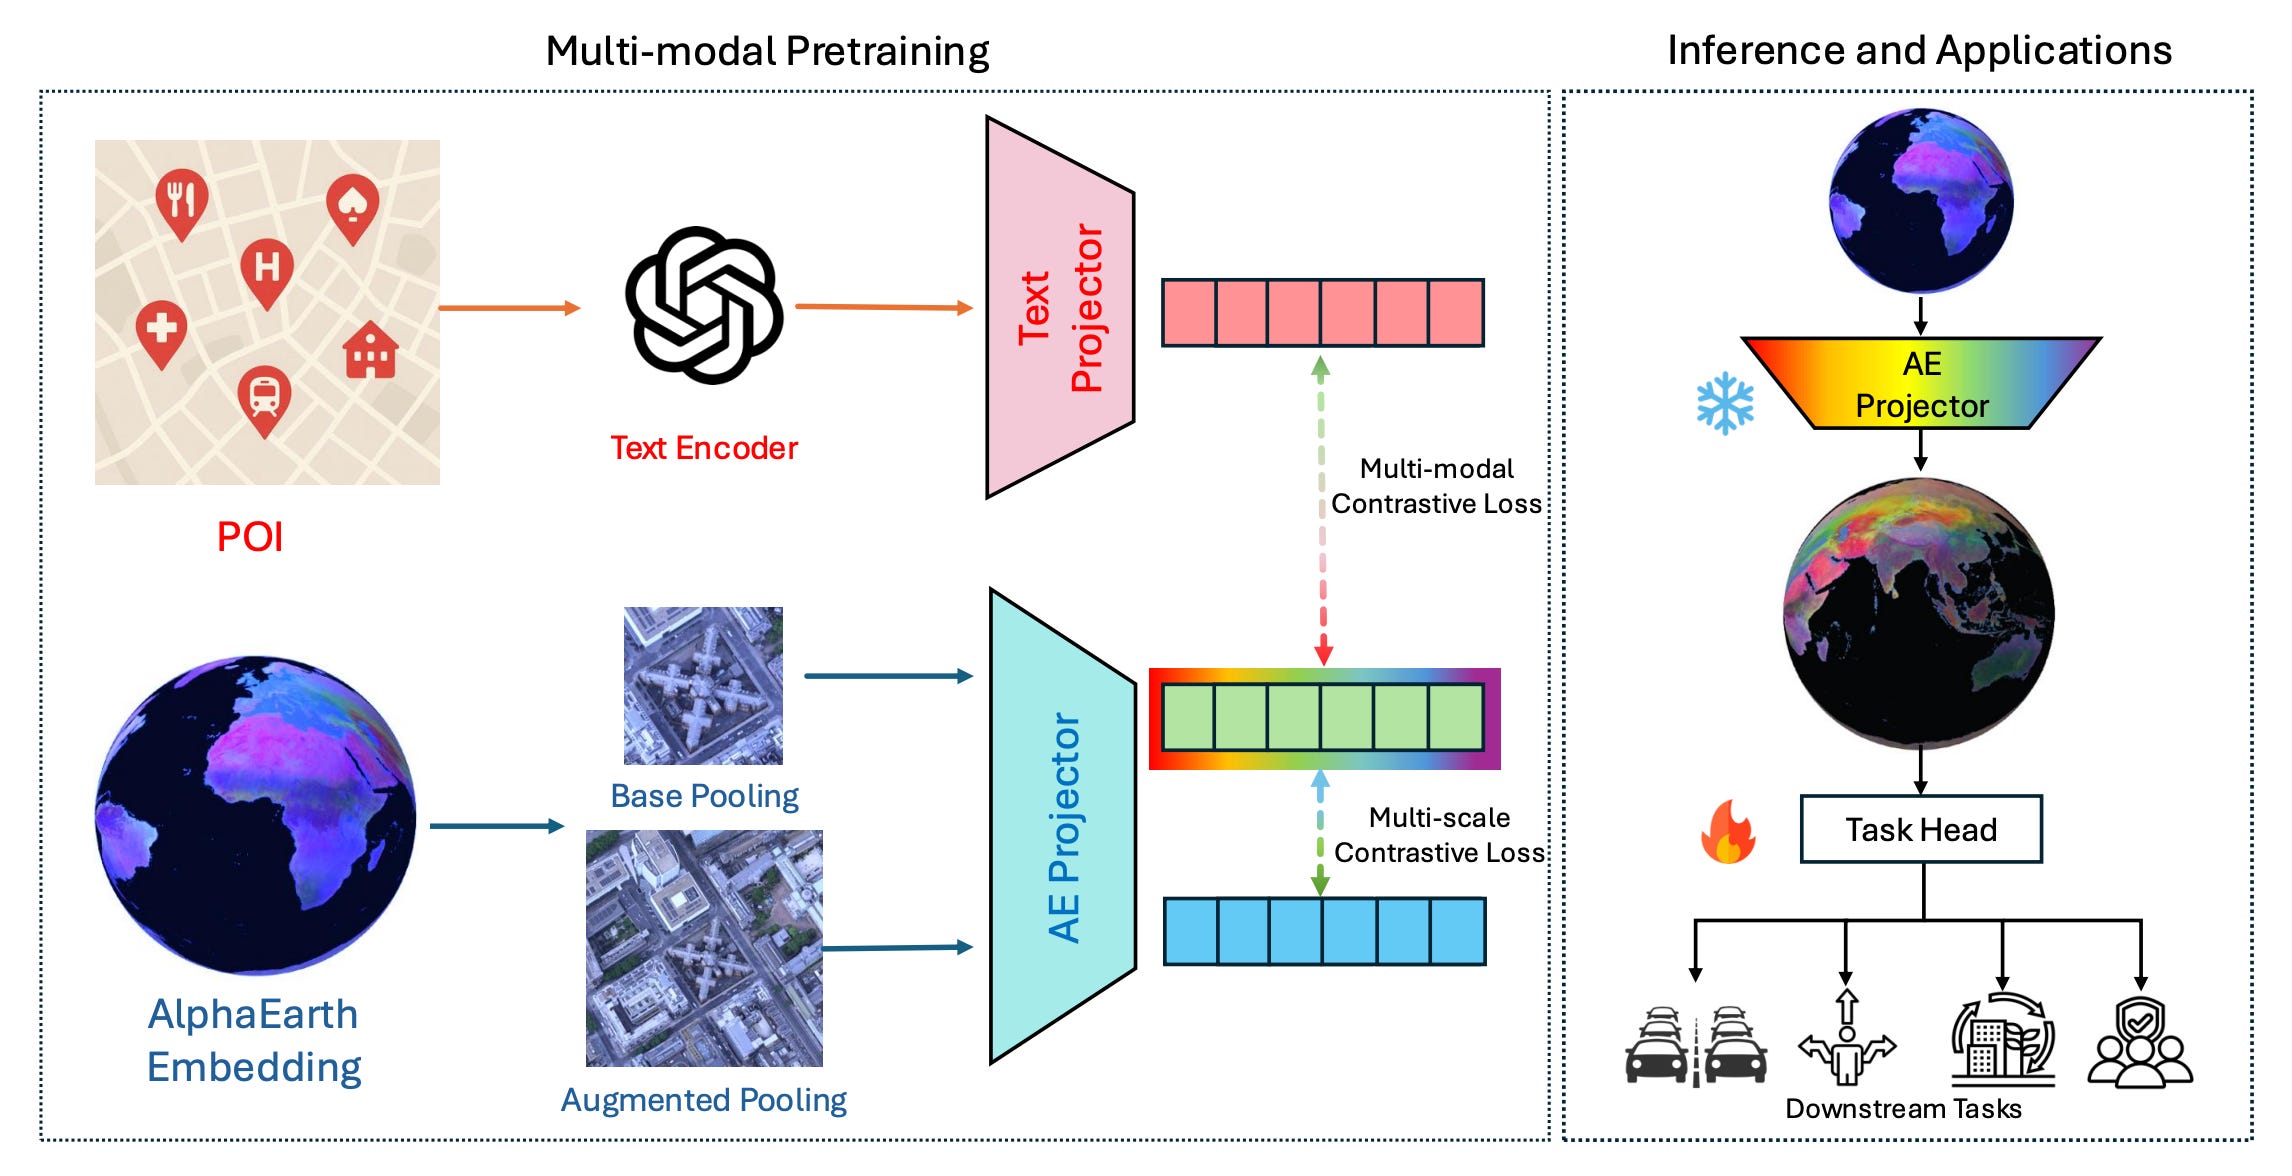
If you’ve used satellite images before, then you’ve most likely used it for some of the most common use cases like detecting changes in deforestation or urban sprawl. However, remote sensing struggles to capture the ‘human’ side of cities, like socioeconomic status or specific building functions. A new framework called AETHER fixes this gap by combining Earth Observation data (specifically Google’s AlphaEarth) with text-based Points of Interest. The researchers found that while satellite data sees the physical form, the text data explains the function. So blending them gives you a much richer picture of urban environments.
To make this work, the researchers used a technique called multimodal alignment to link visual embeddings with text descriptions. They adopted a dual-buffer approach that looks at a 50-metre radius for the specific site and a 100-metre radius for the surrounding context. By doing this, the model learns what a location looks like AND what happens there. It pretty much forces the satellite data to learn from the semantic richness of the POI text. This creates a better representation of urban spaces than pixel data could manage on its own.
The team tested this in London and saw some pretty big improvements. The AETHER model outperformed standard baselines on tasks like Land Use Classification and Socioeconomic Distribution Mapping. It turns out that injecting human-centred semantics into the mix lowers the error rate significantly when trying to map out things like population density or occupation types. Who woulda thought…
2. A new framework for mapping healthcare demand
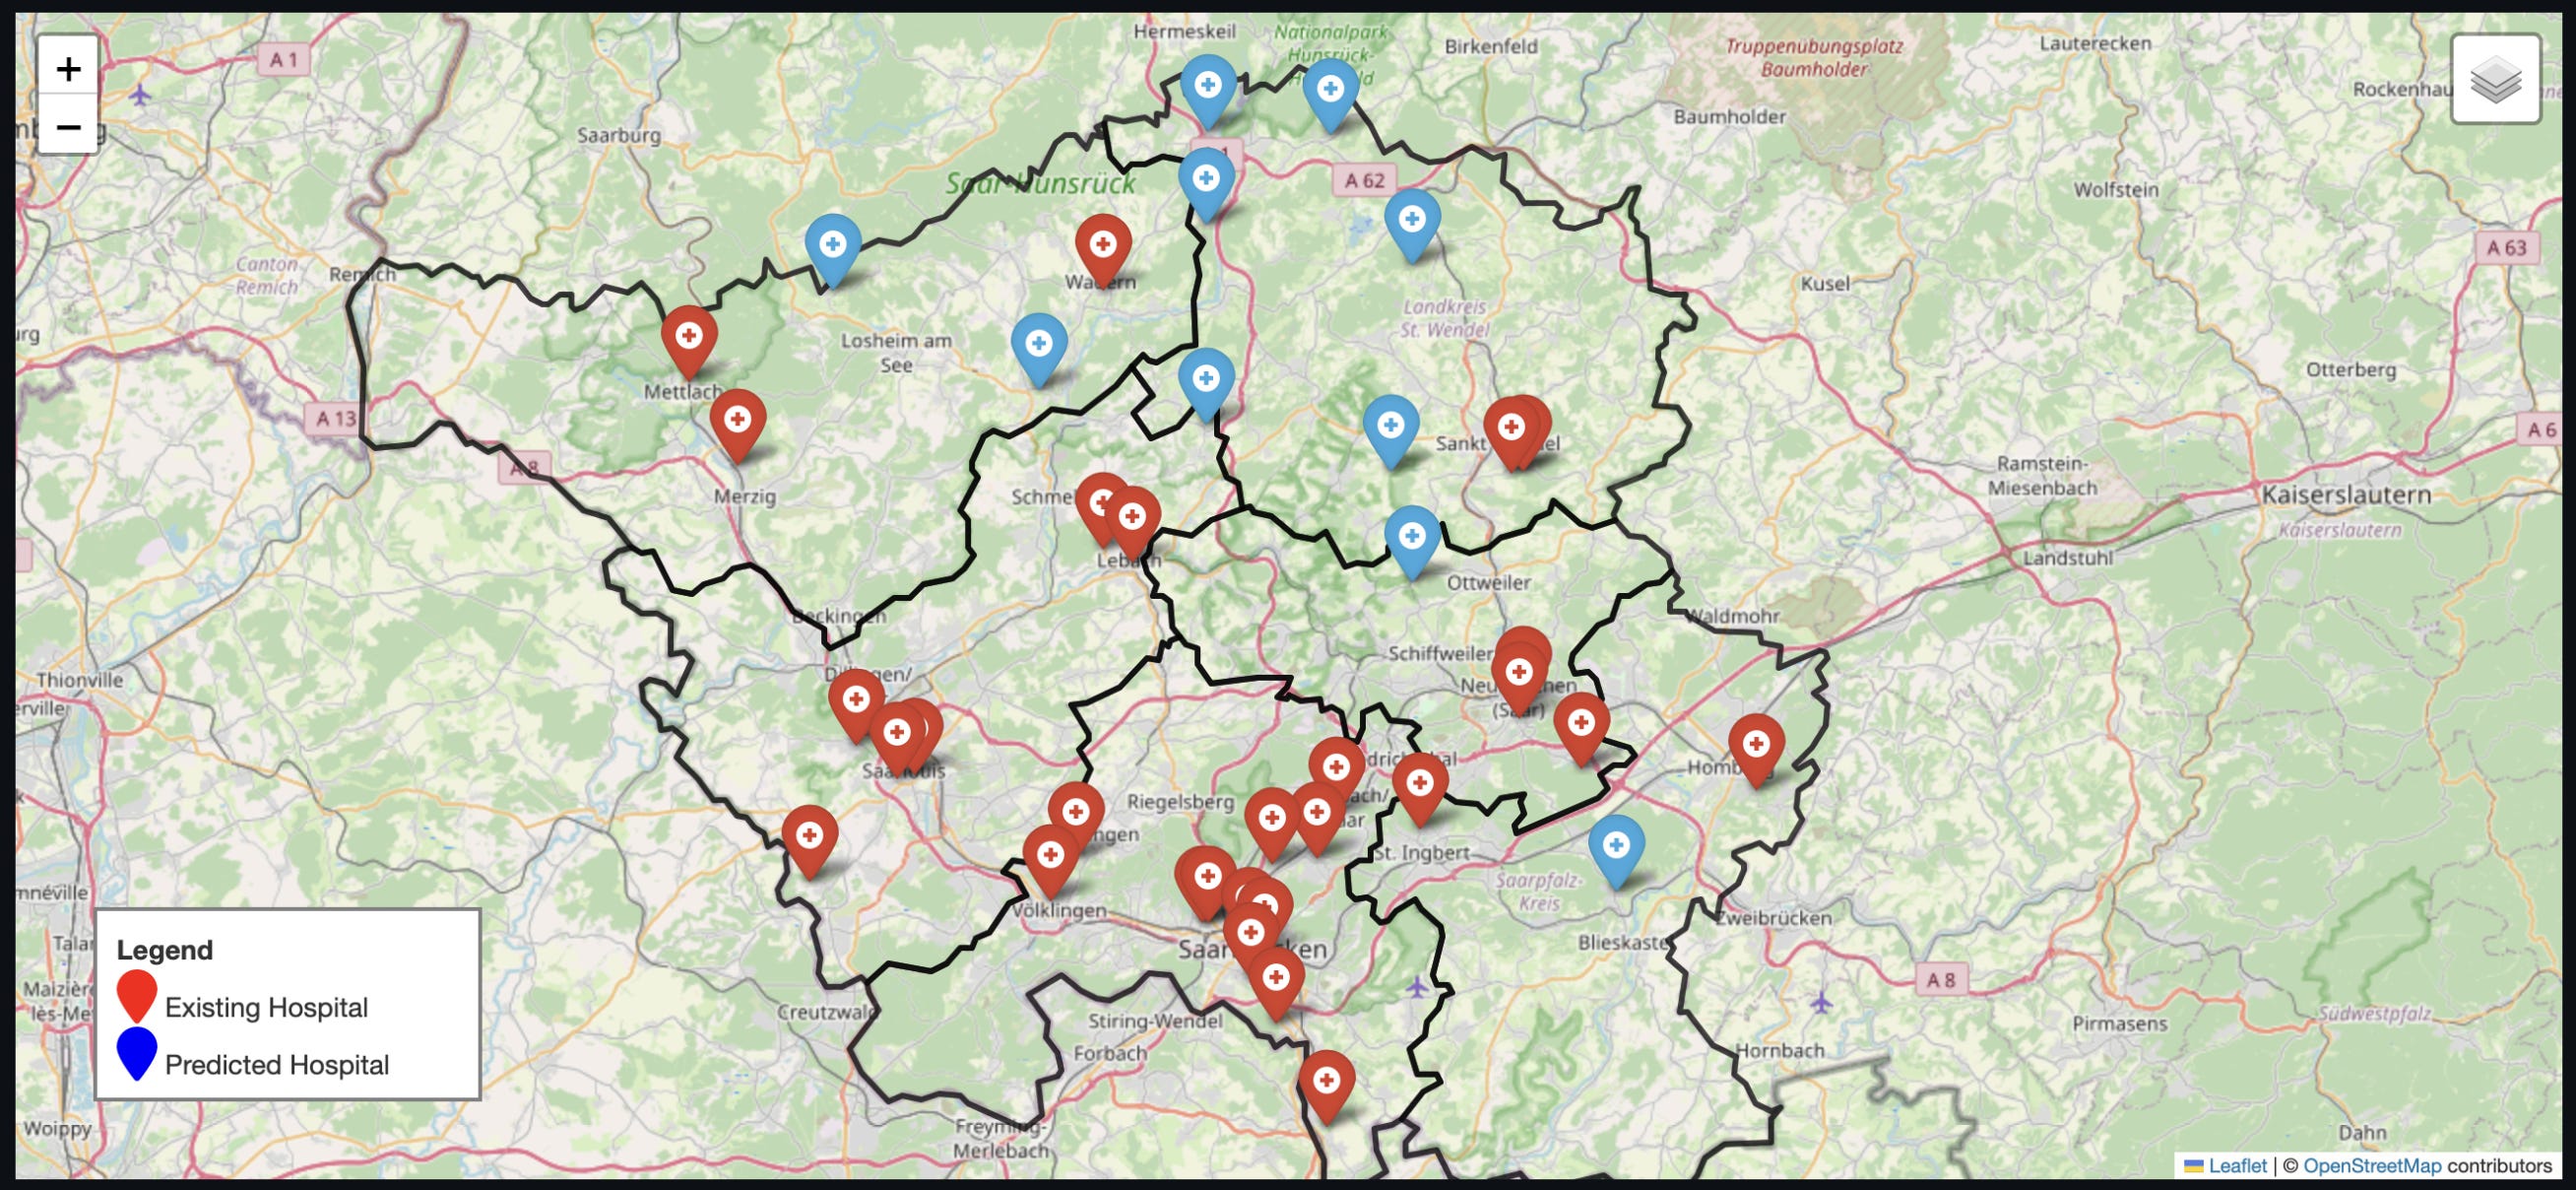
Access to hospital care should be easy for everyone, yet even in wealthy regions, some communities face pretty big hurdles. As the population ages, these gaps in access risk widening and leaving underserved districts with higher health costs. A new paper from researchers at Saarland University tackles this by introducing a unified framework called EA-GeoAI. Previous studies have generally looked at travel times or population changes in isolation, so this approach advances the field by bringing everything together into a single decision tool to guide hospital placement.
The researchers combine district-level demographic shifts, ageing population density and infrastructure data into a unified Equity Index. They use an interpretable Agentic AI optimiser to allocate beds and identify new facility sites. The system acts like an intelligent agent that perceives the healthcare landscape through multiple data sources and proactively generates solutions. It balances the need for efficiency with fairness by minimising travel times and ensuring that vulnerable populations receive adequate coverage. It’s a smart way to ensure that hospital planning keeps up with future needs through 2030.
The results show that this AI-driven approach works much better than the status quo or simple population-based models. The model suggested placing new hospitals in the northern and eastern districts of Saarland where travel times were poorest and the elderly population was most vulnerable. By clustering new facilities in these underserved areas, the model cut average travel times significantly and improved equity scores. It provides a scalable and transparent framework that policymakers can use to make data-driven decisions that actually help the people who need it most.
You can access the code here.
3. Irrigation is cooling some heat extremes but is quietly worsening others

We often assume irrigation helps cool the local climate through evaporation, acting as a buffer against rising temperatures. However, a new study in Nature Communications explores a surprising trade-off in how this water use interacts with future warming. The authors developed a new dataset to model future irrigation techniques under different socioeconomic pathways to see how they impact local climate. They looked at a ‘green road’ scenario where efficiency improves and a ‘rocky road’ scenario where irrigation expands rapidly without efficiency upgrades, particularly in developing regions like Africa. This allowed them to analyse how these choices impact heat stress over the next 50 years.
The findings reveal a pretty big divergence between dry heat and moist heat. While pouring water on crops reduces dry-heat extremes by cooling the air, it simultaneously pumps humidity into the atmosphere. This spikes ‘moist-heat’ stress (measured by wet-bulb temperature), which is actually more dangerous for human health as it limits the body’s ability to cool down. Under the high-emissions scenario, the study predicts that new irrigation hot spots will emerge. Consequently, the combination of global warming and increased humidity means frequent exposure to dangerous moist-heat levels will likely outpace the benefits of local cooling.
It turns out that irrigation alone can’t reverse the warming trend driven by greenhouse gases. In fact, in places like South Asia, the study shows that irrigation amplifies the hours of exposure to extreme moist heat. The research highlights that limiting the expansion of unsustainable irrigation and switching to efficient methods like drip or sprinkler systems is crucial. These efficient techniques apply less water and therefore limit the humidity surge. Ultimately, this suggests that without cutting emissions and improving water efficiency, agricultural regions face a compounding risk of pretty severe humid heat.
4. Turns out wildfire smoke impacts more than just lungs

Landscape fires are becoming a frequent headline, and we generally assume the smoke is bad for our lungs. However, a new study in Nature Communications suggests the health impacts on children are far broader than previously thought. The researchers analysed daily hospital admission records from over 1,000 communities across seven countries, including Brazil, Australia, and Canada. By using a machine learning model to calibrate satellite data with ground observations, they created a precise picture of exposure to fine particulate matter specifically sourced from landscape fires (LFS PM2.5).
The results reveal that the danger extends well beyond simple breathing difficulties. The data indicates that exposure significantly raises hospital admissions for a wide array of other conditions, including infectious diseases, cardiovascular problems, and neurological disorders. For every 10 µg/m³ increase in smoke-related particles, hospital admissions rose across the board. It’s worth noting that respiratory and neurological risks appear to climb even at very low exposure levels, whereas risks for conditions like diabetes and cardiovascular disease tend to spike only after the pollution concentration hits a higher threshold of around 15-20 µg/m³.
Geography and economics play a massive role in how these health impacts play out locally. The study found that children in lower socioeconomic regions faced a heavier burden of disease, which is likely due to differences in housing quality and access to healthcare. In terms of age, children between five and nine years old were the most vulnerable group for infectious disease admissions. This implies that while the smoke itself is a global issue, the actual health fallout is unevenly distributed based on where you live and local economic conditions.
You can access the data and code here.
Geospatial Datasets
1. Population projection dataset
This new WorldPop FuturePop release provides global 1 km population projections for every five years from 2025 to 2100, across all five SSP scenarios. The grids spatially allocate national-level projections using subnational estimates and settlement-growth models, making them directly compatible with CMIP climate frameworks.
2. Bioclimactic and topographic variables dataset

This dataset delivers 16 ENVIREM bioclimatic and topographic variables at 30-arcsecond (~1 km) resolution, which provides richer ecological information than standard WorldClim layers by incorporating metrics such as aridity, thermicity, continentality, and growing degree days.
3. Forest condition anomaly maps
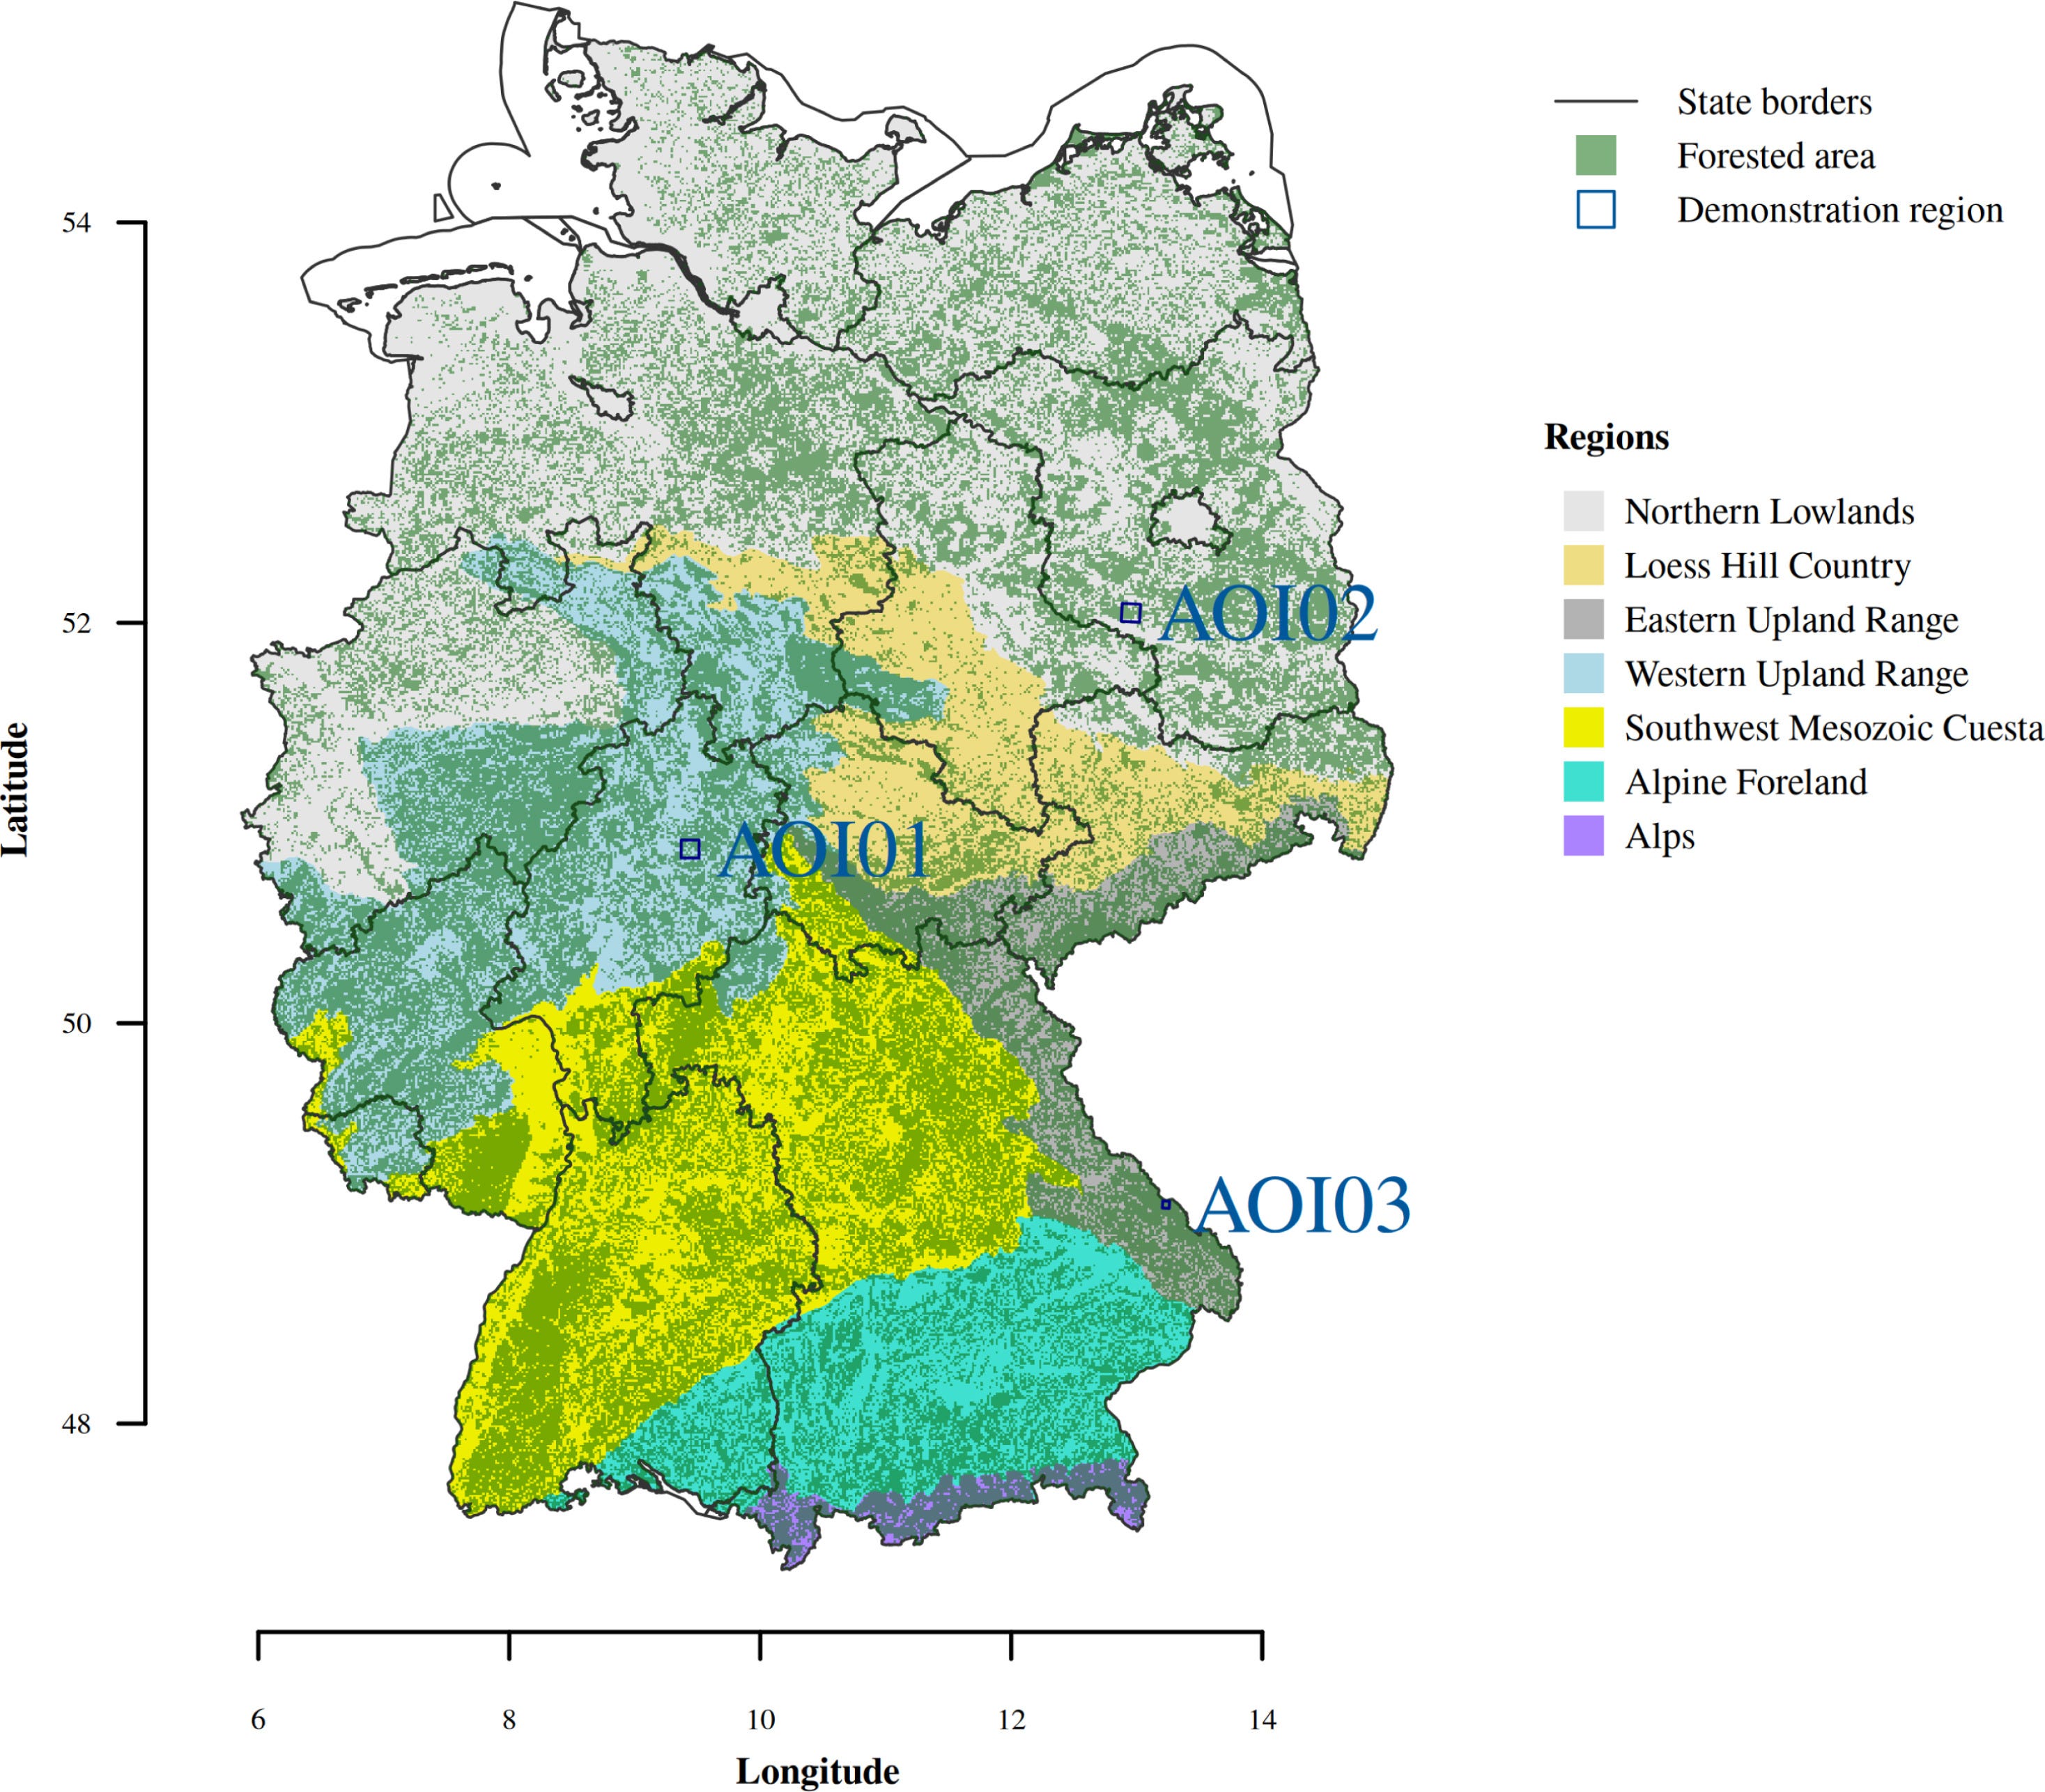
This dataset provides nationwide forest condition anomaly maps for Germany from 2016–2024, derived from Sentinel-2 tree-species-specific reflectance time series. You can also check out the monitor here.
4. Soil and vegetation temperatures dataset
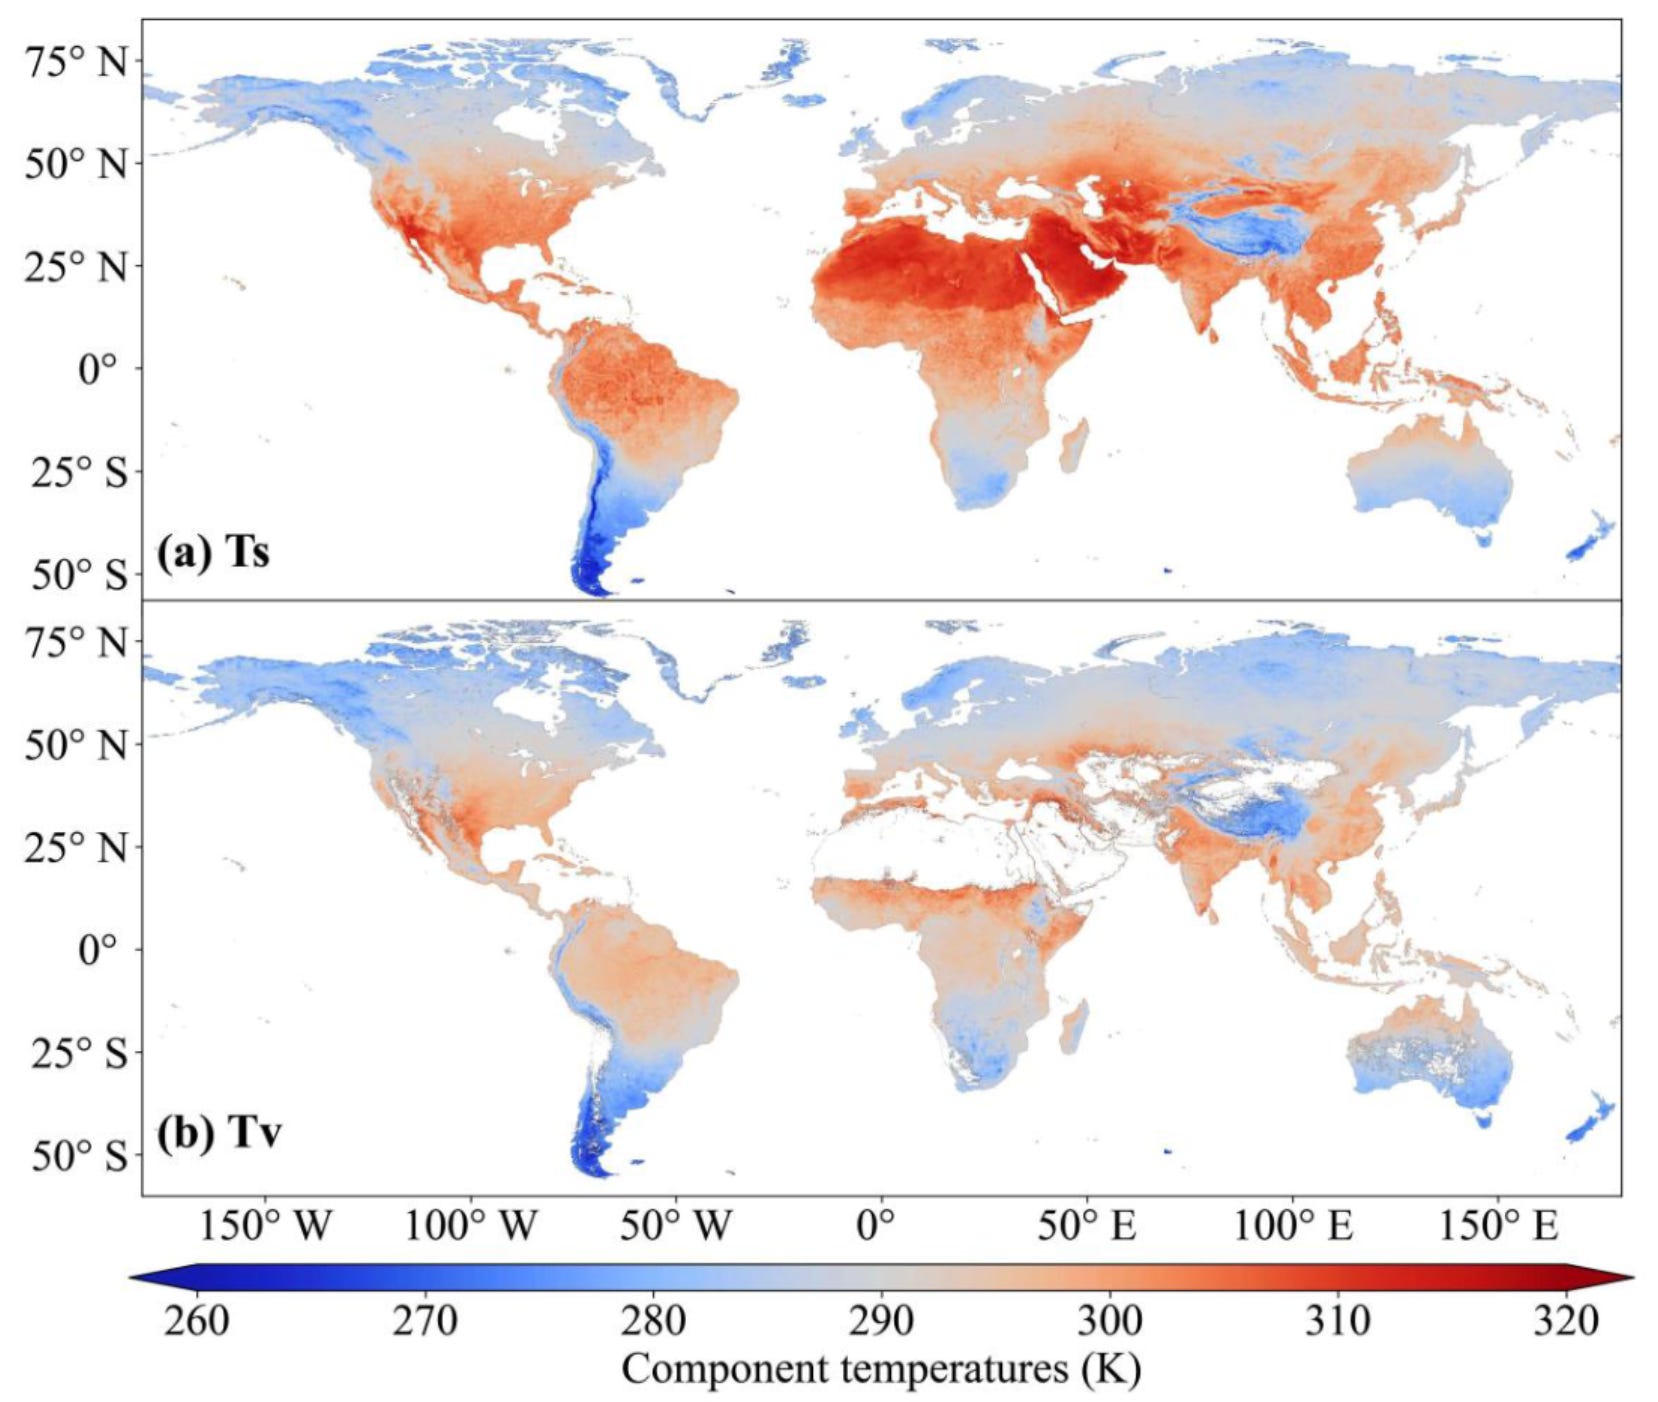
This global dataset offers monthly mean surface soil and vegetation temperatures at 0.05° (~5 km) resolution from 2003–2023, generated using the FuSVeT algorithm applied to MODIS LST and ERA5-Land data. It provides 504 GeoTIFF layers, neatly packaged by year, season, and temperature component.
Other useful bits

Sentinel-6B is heading to orbit to extend the world’s most important sea-level monitoring record, continuing over 30 years of precise ocean height measurements that underpin climate planning and coastal protection. Once launched on a SpaceX Falcon 9, it’ll fly in tandem with its twin for cross-calibration before taking over as the primary sea-level sentinel.
Real-time GIS is giving Amazonian law-enforcement teams a shared operational picture for the first time, letting Brazil, Colombia, Ecuador and Peru track illegal mining, logging and wildlife trafficking as a single connected system. By fusing satellite imagery, field reports and cross-border intelligence on one live map, the UAE-backed I2LEC platform is helping dismantle environmental crime networks that once hid in jurisdictional gaps.
A huge community push has unlocked 465 TB of Google’s AlphaEarth embeddings on Source Cooperative, thanks to an impressive collaboration across the open-geo ecosystem. Asterisk Labs has shared a simple demo showing how to read these embeddings directly as Major TOM products. I think it’s a small but exciting step toward making large-scale geospatial AI far more open, usable and remixable.
Real-time welfare tracking is becoming essential as governments face overlapping shocks, prompting a shift toward systems that blend surveys, big data, geospatial inputs, and modelling to generate timely insights. The World Bank’s new guidance emphasises choosing the “best fit” approach for each policy question and modernising traditional surveys so they can anchor faster, more adaptive monitoring that protects vulnerable communities when crises hit.
Jobs
UNICEF is looking for a Digital Health and Geospatial Health Consultant based in New York.
Mapbox is looking for a Software Development Engineer II based in the UK for their Navigation, Traffic team.
ESA is looking for an Internal Research Fellow (PostDoc) in Geospatial Foundation Models for EO based in Frascati.
Enveritas is looking for a remote Backend Software Engineer to be part of their EUDR engineering team.
Just for Fun

In case you didn’t recognise it, this is a map of Scotland, created in 1457 map of Scotland, by John Hardyng.
That’s it for this week.
I’m always keen to hear from you, so please let me know if you have:
new geospatial datasets
newly published papers
geospatial job opportunities
and I’ll do my best to showcase them here.
Yohan
Really strong piece on multimodal alignment. The dual-buffer approach solves something most urban models overlook, which is taht context matters differently at different scales. Linking visual embeddings to POI text explicitly forces the model to learn function alongside form. The London results prove this isnt just theory, lower error rates on socioeconomic mapping are a big win for practical applications.