

🌐 Some new findings on wealth, place, and opportunity
PLUS: Why global farm sizes could triple by 2100, a survey of foundation models and more.

Hey guys, here’s this week’s edition of the Spatial Edge — your weekly map to the latest geospatial news (sorry)... In any case, the aim is to make you a better geospatial data scientist in less than five minutes a week.
In today’s newsletter:
Wealth Inequality: Local wealth gaps predict economic mobility.
Farm Size Projections: Global farms could triple by 2100.
Multimodal Foundation Models: Survey covers geospatial AI advances.
CO₂ Mapping: Fusing satellite and ground data improves resolution.
WeatherNext 2: Google’s AI model generates forecasts in seconds.
Research you should know about
1. Wealth inequality matters more than income inequality for mobility

A new study published in Nature Communications looks at how growing up in areas with high wealth inequality affects your chances of moving up the income ladder. The author combines local wealth inequality estimates from GEOWEALTH-US with intergenerational mobility data from Opportunity Insights to examine outcomes for children born between 1978 and 1983 across 724 US commuting zones. The results are pretty nuts: children from low-income families (25th percentile) who grew up in areas with relatively low wealth inequality (Gini of 0.70) climbed to around the 47th income percentile in adulthood. Their peers in high-inequality areas (Gini of 0.85) only reached the 37th percentile. Interestingly, static simulations suggest that local wealth inequality is more strongly associated with upward mobility than income inequality itself. A hypothetical 50% reduction in local wealth inequality would boost predicted mobility from the 42nd to the 53rd percentile, while the same reduction in income inequality barely moves the needle.
The study points to education as a key channel linking wealth inequality to reduced mobility. In areas with higher wealth inequality, fewer children from low-income families complete community college degrees. This matters because most low-income children don’t compete for elite universities. They rely on local educational infrastructure, and community colleges are critical stepping stones. The mediation analysis suggests about 30% of the wealth inequality-mobility link can be explained by differences in community college attendance. The mechanism likely works through multiple pathways: property taxes fund local schools, so wealthier areas attract better services; high-wealth households can monopolise opportunities and drive up costs (e.g. skyrocketing university fees); and wealth inequality simply amplifies economic disparities more than income inequality does.
The spatial patterns are telling. Upward mobility is lowest across the South, particularly in the cotton belt, and highest in the Midwest. Wealth inequality shows roughly the inverse pattern. The negative association between local wealth inequality and mobility holds up across a battery of robustness checks, including controlling for racial segregation, restricting the sample to white children only, and using alternative mobility measures. One limitation worth noting is that the wealth inequality data is from 2000, matching when children appeared on their parents’ tax returns during early adolescence. Models using wealth inequality measured before the children were born or when they reached their 30s show no association with mobility, suggesting the timing of exposure during childhood really does matter.
You can access the code here.
2. Global farm sizes could triple by 2100

A new study published in Nature Communications introduces an interesting way to think about farm sizes. Instead of just measuring the physical area of farms (which typically relies on satellite imagery), the authors use what they call ‘socio-economic farm size’ (SFS). This is essentially the total agricultural land area divided by the number of farms. They argue this is an important distinction because two regions with identical physical farm sizes can have vastly different SFS values depending on rural population density and labour availability.
The historical trends are pretty interesting. Between 1970 and 2000, global average SFS actually declined by about 15%, but then reversed course, increasing by 14% from 2000 to 2020. High-income regions like Europe, North America, and Oceania saw exponential growth in farm sizes over recent decades (with SFS roughly doubling in Europe and North America since 1970), driven by early urbanisation and mechanisation. Meanwhile, regions like India and Sub-Saharan Africa experienced the opposite: farm sizes shrank as population pressures and policies like India’s Land Ceiling Act preserved smallholder economies. China’s an interesting case too. SFS started expanding after 2000, but remains relatively small due to the Household Contract Responsibility System, which created structural fragmentation by dividing land into small, non-tradable plots.
Looking ahead, the projections are dramatic. Under a middle-of-the-road socioeconomic scenario (SSP2), global average SFS could triple by 2100, jumping from about 70 hectares in 2020 to over 300 hectares. Latin America and North America are projected to see the largest expansions (roughly six-fold increases), while Asia and Sub-Saharan Africa would see more modest growth (around 2.4 times current sizes). The main driver is declining rural populations combined with continued urbanisation. African countries like Kenya, Mali, and Nigeria could see their farm sizes start expanding around 2060 as demographic transitions take hold. Of course, these projections come with a bunch of uncertainty. Policy interventions, land reforms, and market dynamics could all alter these trajectories in ways the model doesn’t capture.
You can access the data and code here.
3. A survey of multimodal geospatial foundation models
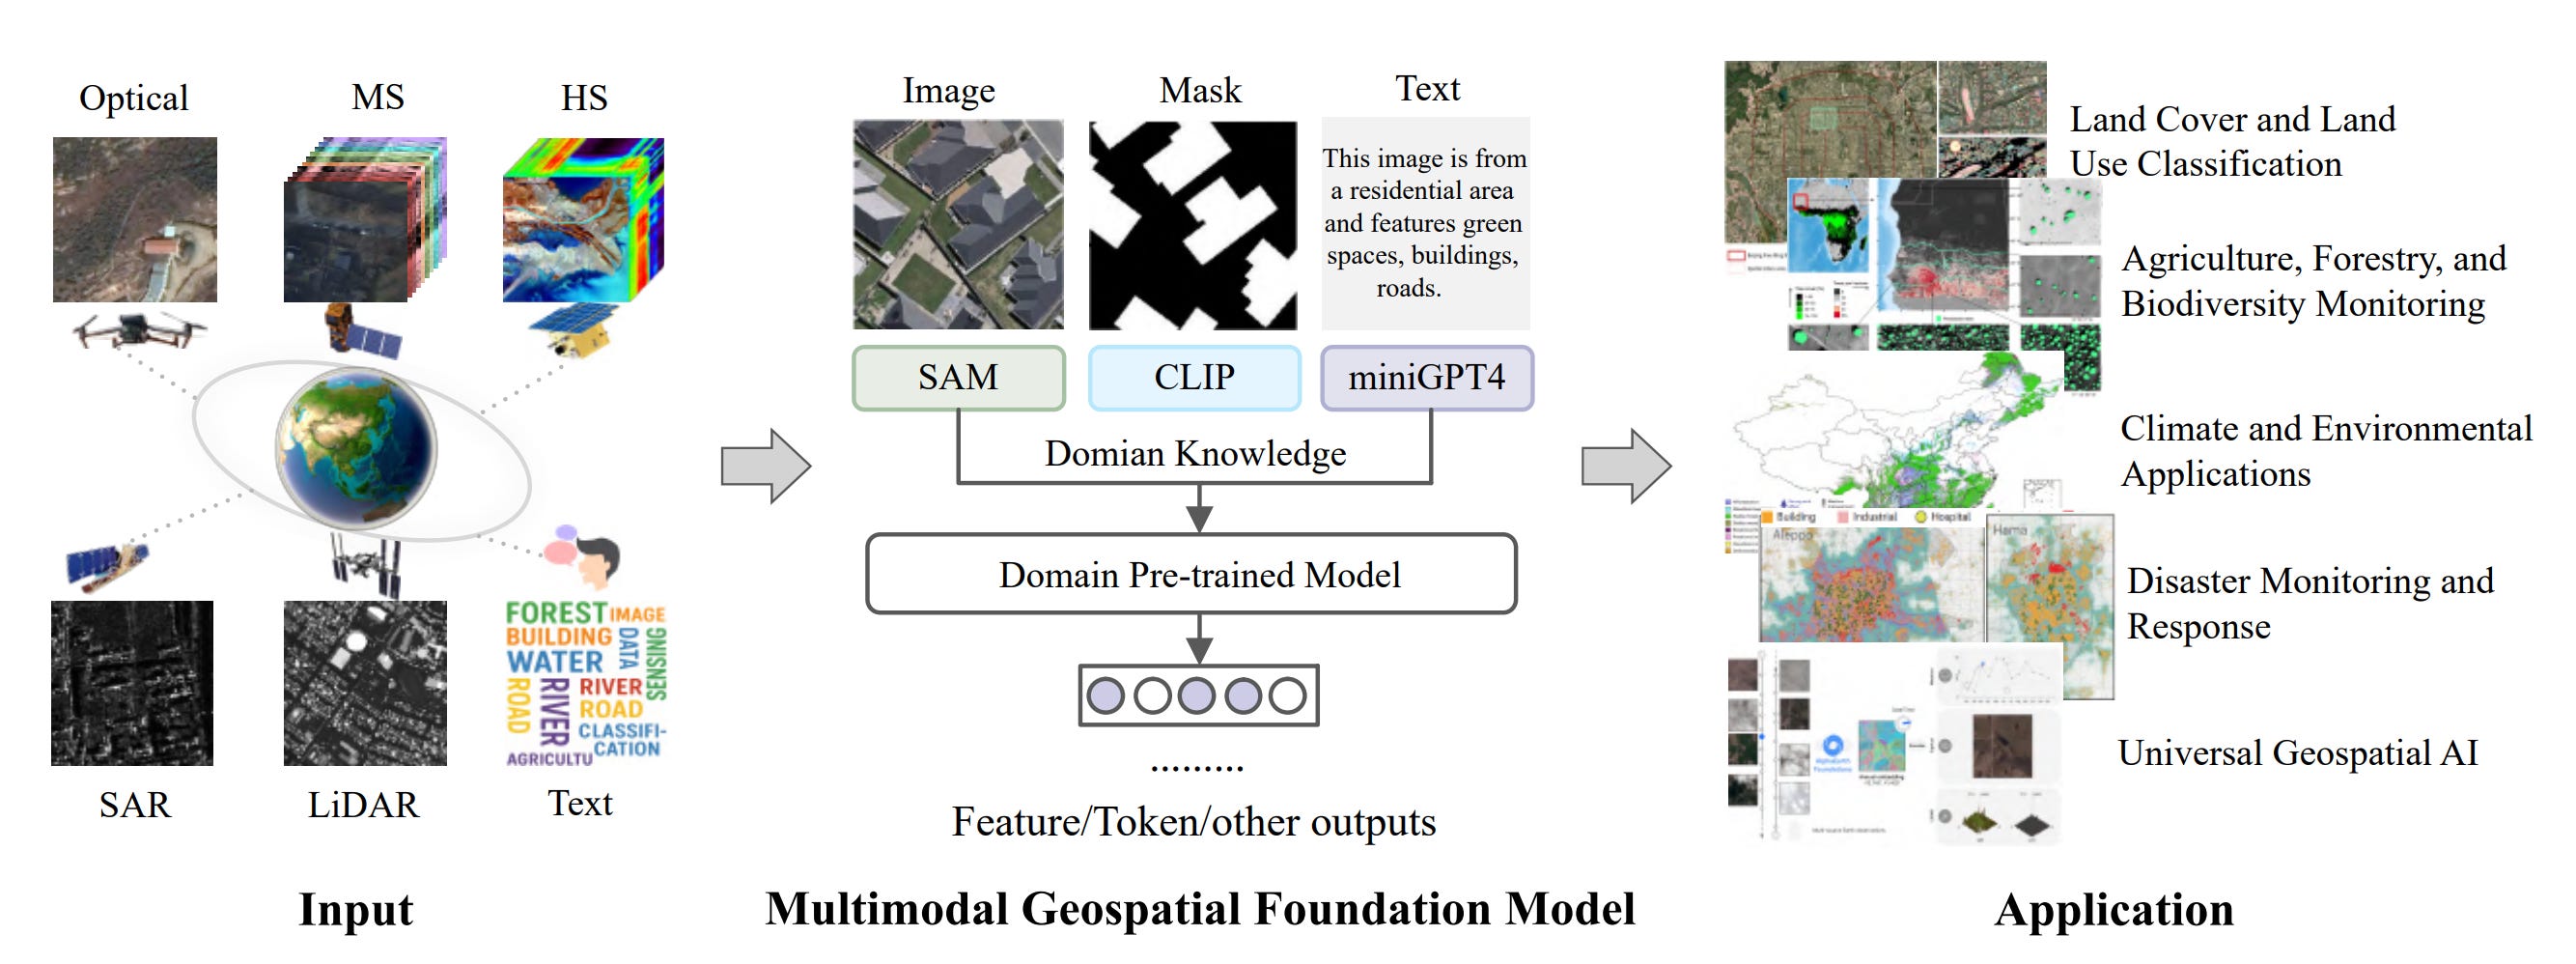
It’s pretty difficult to go a week in the geospatial space without discussing foundation models. This week is no exception. A new survey provides a comprehensive look at how these models are evolving to handle multiple data types simultaneously. The key insight here is that different remote sensing modalities (optical RGB, SAR, hyperspectral, LiDAR, and text) each have distinct physical properties that fundamentally shape how models need to be designed. E.g., combining optical imagery with SAR is particularly challenging because they have completely different imaging mechanisms, leading to big differences in spatial structures and texture features. Meanwhile, hyperspectral data brings its own headaches. You’re dealing with tens to hundreds of spectral bands compared to just three in standard RGB imagery, which creates issues around spectral redundancy and noise sensitivity.
The survey reveals some interesting patterns in how well these models actually perform. Vision-language models are obviously emerging as the most promising direction, with natural language serving as a sort of semantic bridge for human-machine interaction. Models like RS-MoE use dynamic task-specific prompts to guide multiple lightweight language model experts, enabling specialised parallel processing of diverse tasks like image captioning and visual question answering. But there’s no single model that dominates across all tasks. Instead, different architectures excel at different things. GeoRSCLIP performs well on image-text retrieval thanks to fine-tuning on linguistically diverse datasets, while EarthGPT’s multi-scale visual perception module gives it an edge on visual grounding tasks that require fine-grained spatial understanding.
The practical applications are already pretty impressive, ranging from precision agriculture to disaster response. One notable example is how researchers have used these models for global-scale tree mapping across the Sahara and Sahel, which helps develop our understanding of land degradation and carbon sinks. For disaster monitoring, new approaches are enabling near-real-time building damage estimation by integrating multiple data sources. But the authors are candid about the challenges that remain: most state-of-the-art models are trained end-to-end with limited interpretability, which is a real problem when you’re making high-stakes decisions about things like climate policy or emergency response.
4. Fusing OCO and ICOS data for high-res CO₂ maps

Monitoring CO2 emissions at the local level can be pretty tricky. Local authorities often rely on national-level data or extrapolations from limited ground measurements, which makes it hard to pinpoint specific emission sources or design targeted climate strategies. A new study published in Scientific Reports tackles this by fusing satellite data from NASA’s Orbiting Carbon Observatories (OCO-2 and OCO-3) with ground-level observations from the Integrated Carbon Observation System (ICOS) network and ERA5 weather data. The authors trained a bunch of machine learning models to predict ground-level CO2 from satellite measurements, with a multilayer perceptron neural network achieving the best results: an RMSE of 3.58 ppm and an adjusted R² of over 80%. That’s a pretty solid improvement over a baseline model using satellite data alone (RMSE of 6.21 ppm).
The interesting bit is that the model’s input features come entirely from satellite and reanalysis data, meaning predictions aren’t confined to locations with ground stations. Obviously, this can be an issue since reanalysis data is itself modelled data. In any case, the authors are able to generate high-resolution CO2 maps across Europe and even at the municipal level in southern Sweden. Their SHAP analysis reveals that the satellite-derived column CO2 measurement is the most important predictor, followed by temperature variables (which serve as proxies for vertical CO2 movement) and spatiotemporal information. To fill in gaps where satellite coverage is sparse, they use a weighted K-nearest neighbour interpolation that balances smoothness against local detail.
There are limitations worth noting. The ICOS stations used for training are mostly in rural European locations, so the model may not generalise well to urban or industrial areas, or to other continents. OCO satellites also have uneven coverage, with fewer observations near the poles and during winter months. The authors are upfront that predictions outside Europe can’t be verified without additional ground truth data. Still, for European applications using yearly or multi-year averages, this approach offers a promising way to identify emission hotspots, track changes over time, and support local climate action without needing expensive new monitoring infrastructure.
Geospatial Datasets
1. Forest carbon estimates dataset

This dataset produces fine-scale estimates of forest carbon status, trends, and change. It provides annual county-level forest carbon estimates over 14 years. You can access the data here.
2. Environmental discussions on Twitter (X?)

This dataset captures how environmental issues are discussed on Twitter, drawing on posts from 200,000 users who follow major environmental NGOs across multiple countries. It includes geo-referenced measures of issue prominence across the coterminous United States, showing how topics like decarbonisation or species conservation vary across states and often align with county-level political ideology. The release contains processed data, issue-intensity tables, user tweet IDs, and full reproduction code for the study’s analyses. You can access the data here.
3. Geodiversity dataset

This new geodiversity dataset offers a comprehensive view of Europe’s non-living natural diversity, spanning 78 geological, pedological, geomorphological and hydrological features. It’s available at 1-km and 10-km resolution. You can access the data here.
4. Climate simulations dataset
This dataset offers 9 km resolution climate data, indicators, and impact variables for Austria, produced through the DISTENDER project’s first round of Dynamical DownScaling using the ICON-CLM model driven by EC-Earth3-Veg. It includes simulations for 2011–2020 (historical) and 2041–2050 (future scenarios), based on the GLOBCover-2009 land-use dataset. It was released as part of the EU-funded DISTENDER initiative.
Other useful bits
Google has launched WeatherNext 2: a faster, higher-resolution AI weather model that can generate hundreds of realistic forecast scenarios in under a minute. The new system now powers forecasts across Google products and is available in Earth Engine, BigQuery, and Vertex AI.
A new World Bank study shows how AI and synthetic data can help track how research datasets are cited, even when references appear in wildly different forms. By expanding small annotated samples into richer training sets, the approach improves model generalisation. It reveals gaps in how data are used, offering a scalable way to understand the flow of knowledge across disciplines.
ESA have conducted a study to highlight how satellites can play a central role in climate adaptation: monitoring hazards, ecosystems, agriculture, and health with consistent, decades-long global data. By feeding directly into the Paris Agreement’s adaptation goals, they argue that Earth observation offers a useful way to measure whether resilience efforts are working and where support is most needed. But then again, since you’re here, you probably knew this already…
A new global crustal stress map has doubled the number of measurements since 2016, revealing where Earth’s crust is most strained, and where faults may be closest to failing. Built from 100,000+ data points, it sharpens earthquake risk assessments and guides safer drilling, geothermal projects, and carbon storage by showing how stress varies from continental scales down to surprising local rotations.
Jobs
International Water Management Institute (IWMI) is looking for a remote Consultant
Mapbox is looking for a Software Development Engineer II based in the United Kingdom
Janaagraha Centre for Citizenship and Democracy is looking for a Associate - Data Science based in Bengaluru, India
Just for Fun

An image of the moon from Turkey last month.
That’s it for this week.
I’m always keen to hear from you, so please let me know if you have:
new geospatial datasets
newly published papers
geospatial job opportunities
and I’ll do my best to showcase them here.
Yohan