

🌐 A new geospatial GDP dataset (that doesn't involve nightlights)
PLUS: some surprising vulnerabilities when using pre-trained models, examining travel patterns in Africa and more.


Hey guys, here’s this week’s edition of the Spatial Edge — a weekly round-up of geospatial news that’s as silky smooth as your favourite digital elevation model. The aim is to make you a better geospatial data scientist in less than 5 minutes a week.
In today’s newsletter:
GDP Data: Global subnational GDP dataset sans nightlights.
Travel Patterns: Seasonal mobile data reveals Africa’s travel shifts.
Model Risks: Public pre-trained models prone to adversarial attacks.
Data Bias: Balanced pre-training data boosts model accuracy.
FathomDEM: new 30m digital elevation model
1. New geospatial GDP dataset (created without using nightlights)

If you’ve read an economic paper in the last ten years that examines trends at the sub-national level, then chances are you’ve come across nightlights data.
The original economics paper that used nighttime luminosity as a proxy for economic activity now has over 3,000 citations.
But, as I’ve harped on over the last few years, nightlights aren’t a panacea. There are several issues with it, including:
light reflecting off snow
ephemeral light (e.g. lightning)
the angle of the satellite influencing light and so on.
You can read more about these limitations with nightlights here and here.
So given these limitations, I’m always interested in new and alternative geospatial datasets on economic activity.
This is why I was particularly interested in this new paper in Scientific Data.
It introduces a global dataset of GDP per capita (PPP) at a 5 arc-min resolution from 1990 to 2022. The interesting thing — they didn’t use nightlights.
They compiled national GDP per capita figures from sources such as the World Bank, IMF, and CIA for 237 countries, and merged these with subnational data from OECD, Eurostat, and national censuses. They addressed missing values using linear interpolation and a new extrapolation method based on linear regression with data from nearby countries.
At the provincial level (i.e. admin-level 1), they calculated the ratio of subnational to national GDP and applied population-weighted averages to harmonise the data. For municipal-level (i.e. admin-level 2) estimates, they used boosted ensemble trees (a method that combines several decision trees to improve prediction accuracy) while also considering independent factors such as urbanisation, travel time to the nearest city, and income inequality.
This downscaling model performed pretty well, with R² values of around 0.79 to 0.80 and a Pearson correlation of 0.88 when compared with independent OECD data.
2. Tracking seasonal travel patterns with phone data and maps

A new pre-print study posted on Research Square maps out seasonal travel across Africa using anonymised smartphone data mixed with various geospatial datasets.
It's a follow-up to earlier work in Scientific Reports that dug into the spatial and social factors behind human movement. In this study, the focus is on how travel patterns shift month by month during 2018–2019, looking at a bunch of factors like rainfall, local GDP per capita, child health, and education levels that seem to steer how people move around.
The researchers used a Bayesian approach to blend the Google Aggregated Mobility Research Dataset with environmental and social measures, essentially filling in the gaps where cellphone data is thin. This allowed them to estimate monthly travel flows at both national and subnational levels. They found that features like stream runoff (which tells you how much rain is building up in rivers) and vegetation moisture are closely linked to seasonal migration patterns. Local climate and household well-being also appear to influence both the everyday short trips and longer journeys.
So, why should we care?
This essentially provides a big-picture view of how travel patterns shift across Africa, which could help us better understand movement trends. The idea is this can lead to better decisions on transport, infrastructure, and even social services in areas where data’s been lacking.
3. Discovering vulnerabilities of transfer learning in remote sensing

A couple of weeks ago I discussed geospatial foundation models, which essentially involve pre-training a model on A LOT of data and then fine-tuning it for a specific purpose.
Given this is still fresh, I was interested to see this new study from some folks at NTU Singapore which explores how public, pre-trained deep learning models might also introduce hidden vulnerabilities.
They have found that attackers can use widely available pre-trained models as "proxies" to create adversarial examples.
The main idea is called Adversarial Neuron Manipulation (ANM). Instead of tweaking an image to fool one specific target model, ANM alters the image in subtle ways to maximise the response of certain neurons in a well-known pre-trained model. These barely noticeable changes then end up reducing the performance of any later model that reuses those pre-trained weights.
Unlike typical black-box attacks, which try to guess the inner workings of a model without seeing its details, ANM directly activates targeted neurons in the public model. The researchers even found that by simultaneously targeting several carefully chosen "fragile" neurons (those that are particularly sensitive), the attack becomes more transferable and dramatically decreases image classification accuracy. In tests on well-known aerial image datasets, these small, nearly invisible tweaks caused accuracy to drop by over 70% in many cases.
This work shows that the common practice of using pre-trained feature extractors in remote sensing tasks can come with some potential risks. This is not something I’d read before, and I’m guessing this is a pretty foreign issue to most of us in the geospatial space. So it’s just something to be aware of when using these models.
I’ve said it before and I’ll say it again — foundation models are not a panacea.
4. How spatial distribution affects geospatial models
A new paper from researchers at Arizona State University and the University of Colorado Boulder examines how the spatial distribution of pre-training data influences the performance of geospatial foundation models.
It looks at tasks tied to climate, agriculture, and biodiversity to understand whether balanced and representative data are more critical than simply amassing large quantities of satellite imagery.
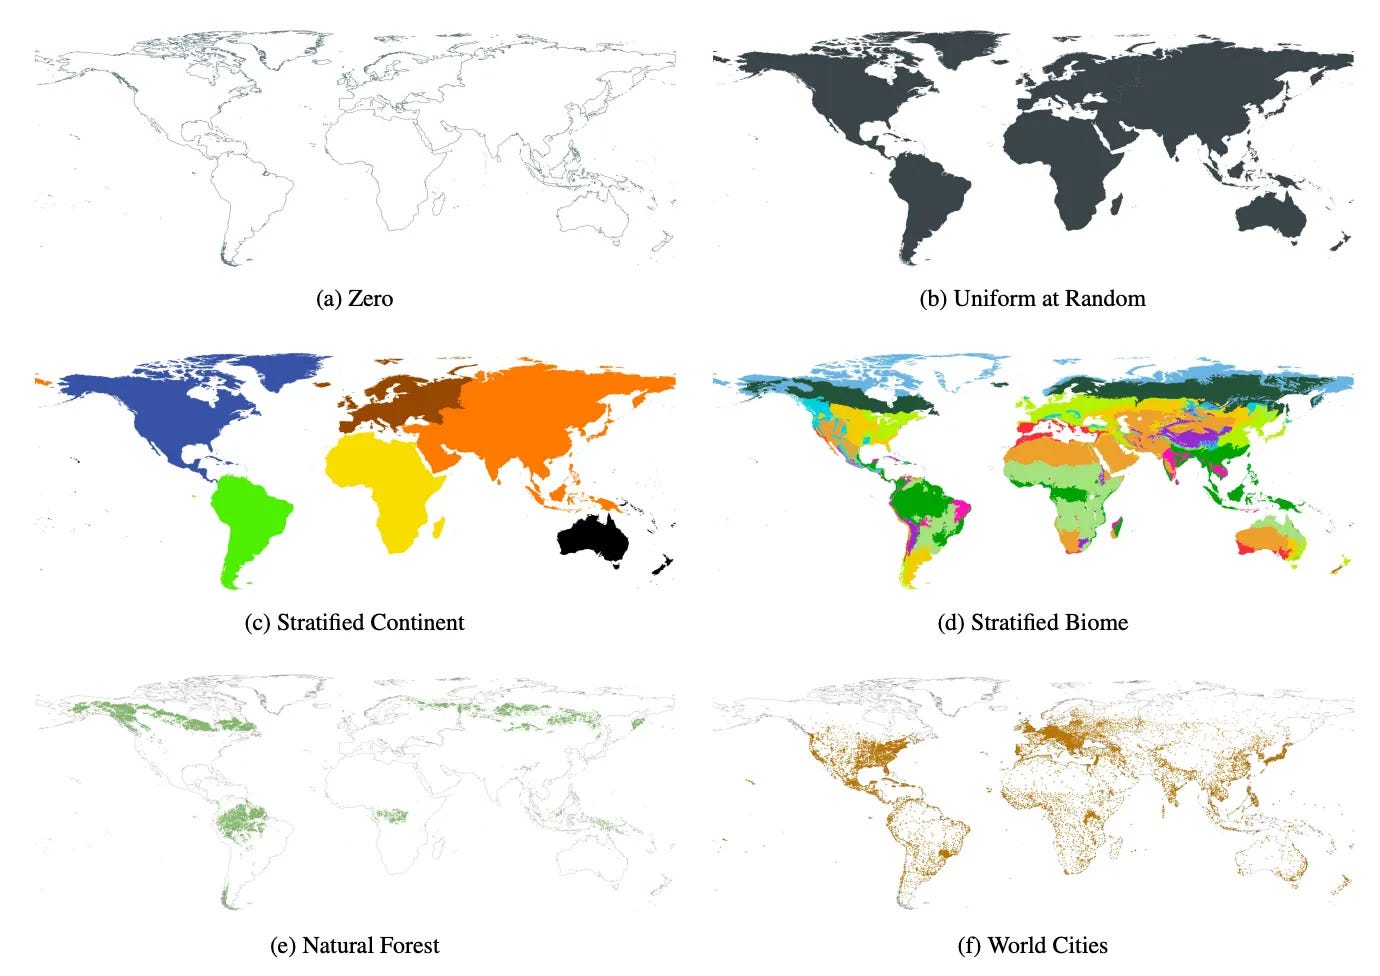
The authors tested five sampling approaches, ranging from random global selection to region-specific strategies, on two foundation models: Presto, which processes pixel time-series data, and SatCLIP, which encodes location coordinates. They evaluated each model using agricultural (CropHarvest) and ecological (EcoRegions) classification tasks in a few-shot setting with very limited labelled data. Their findings indicate that balanced, globally representative sampling tends to outperform region-focused or clustered methods and that the exact benefits can vary depending on the model’s design.
These results suggest that diversity in pre-training datasets is pretty important for getting accurate models, especially when only a small amount of training data is available. I guess this isn’t new, but it’s an important reminder.
Geospatial datasets
1. Global rice database

I’m not sure why, but for some reason, I spend a lot of my week looking at geospatial rice datasets. So for those who are geospatially rice-curious, then you’ll like the GloRice (v1.0) dataset which provides a 61-year (1961–2021) global view of paddy rice distribution at 5-arcminute resolution. It distinguishes both harvested and physical (field) areas. You can access the data and code here.
2. Fathom Digital Elevation Model

FathomDEM is a global 30m digital elevation model. It’s produced using a hybrid vision transformer model. It removes surface artefacts from a global radar DEM, Copernicus DEM, aligning it more closely with true topography. You can access the dataset here.
Other useful bits
ESA Φ-lab and CloudFerro have expanded Major TOM embeddings. This update introduces over 169 million embeddings from Sentinel-1 and Sentinel-2, enabling more efficient processing of vast EO datasets for machine learning, computer vision, and predictive modelling.
The {spData} package has officially moved away from shapefiles, embracing modern geospatial data standards for more efficient workflows. Upgrade your workflows here.
The Sentinel-2A satellite is getting a temporary extension campaign starting in March 2025, enhancing global Earth observation coverage. It will shift its orbit to provide additional imagery every 10 days over Europe and every 20 days globally, complementing Sentinel-2B/2C. This one-year campaign aims to improve data availability for users.
Jobs
The UK Office for National Statistics is looking for a (1) Principal Geospatial Technologist and a (2) Senior Geospatial Technologist to join their geospatial technology team.
ESA is looking for a Graduate Trainee in Earth Observation in Support of International Development Assistance.
Satsure is looking for a Geospatial Analyst for their data generation team, who will be working with various datasets like satellite imageries, boundaries, and weather data.
Just for fun

I’m a sucker for a good map. This one is an incredibly impressive geologic map of South America.
That’s it for this week.
I’m always keen to hear from you, so please let me know if you have:
new geospatial datasets
newly published papers
geospatial job opportunities
and I’ll do my best to showcase them here.