

🌐 Nightlights aren’t capturing the world’s darkest crises
PLUS: predicting earthquake responses using LLMs, better quality road extraction using AI, and more.

Hey guys, here’s this week’s edition of the Spatial Edge. We put the ‘special’ in geospecial data science… So anyway, the aim is to make you a better geospatial data scientist in less than five minutes a week.
In today’s newsletter:
Conflict Monitoring: Nightlights miss the darkest global crises.
Earthquake Simulation: LLMs predict human responses to tremors.
Road Mapping: New AI model improves network extraction.
AI Copilot: GeoPandas gets natural language support.
Building Data: Global 3D building dataset now available.
Research you should know about
1. Nightlights aren’t capturing the world’s darkest crises
I’ve covered nightlights data on here quite a lot in the past (see here and here), but mainly in how it’s used to measure economic activity. However, it’s increasingly becoming used to monitor conflict.
However, a new paper from Bara and Sticher points out a major limitation: Nightlights can only detect changes where there’s already detectable light. And it turns out that in many conflict zones, especially rural or peripheral areas, there’s no light to begin with. In 2020, nearly a quarter of the global population lived in unlit areas. For those living in districts affected by conflict, that figure rose to 31%.
The authors introduce a practical benchmark called the “NTL threshold”, which shows how densely populated a location must be before there’s an 80% chance of picking up any nightlights signal. In well-lit countries like Singapore, even one person in a small area is enough. But in places like Yemen or the Congo, that threshold can reach thousands.
Unsurprisingly, these thresholds are driven by GDP per capita and urbanisation. Countries with lower income and more scattered populations, often those experiencing conflict, require much higher densities for reliable NTL detection. This urban bias is a problem because the very places where conflict monitoring is most needed are often left out.
A closer look at Sub-Saharan Africa backs this up. Just 1.5% of rural settlements across conflict-affected countries were monitorable by nightlights (defined as having light in at least half the settlement area), compared to 23% of urban ones. And settlements far from regional capitals were much less likely to have any nightlights coverage at all. The authors warn that if we treat nightlights as a neutral, objective dataset, we risk reinforcing the same blind spots found in media-derived conflict data.
2. A new way to simulate earthquake impacts using LLMs
Ok I’ve heard just about every use case for LLMs. But then this one came up, and I got curious.
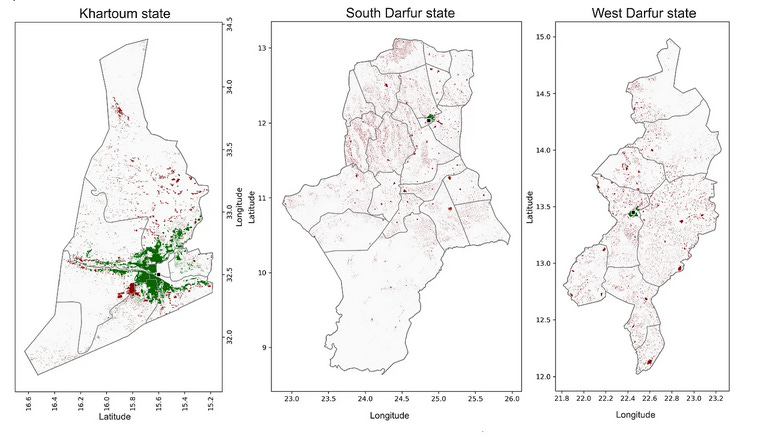
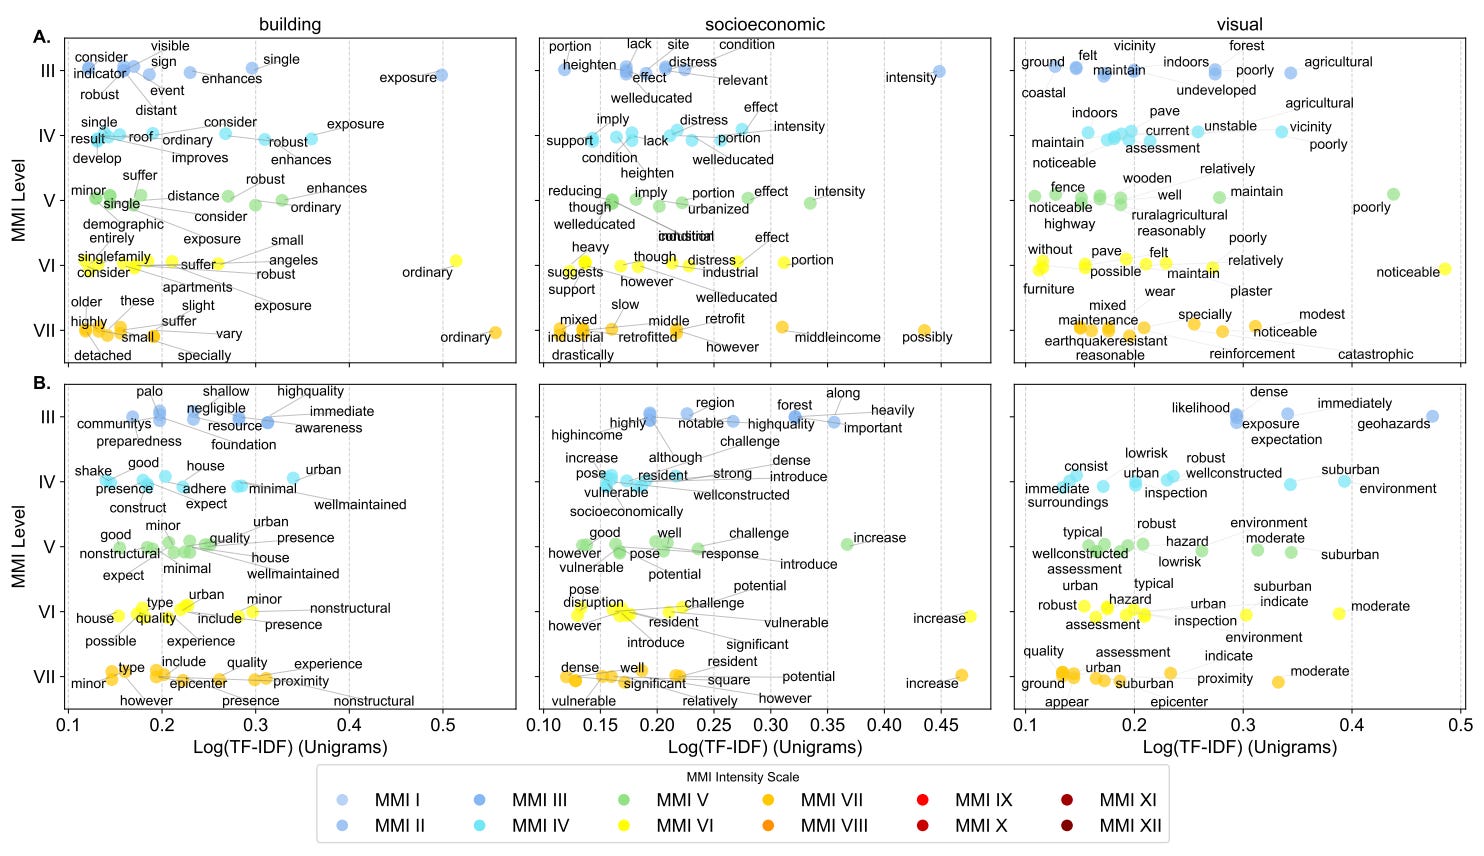
A new study explores whether large language models (LLMs) can act as “synthetic observers” that gauge earthquake impacts before the shaking begins. The model basically aims to estimate how people would feel the event using the Modified Mercalli Intensity (MMI) scale.
Each location is described using data on seismic distance, site conditions, local buildings, street-level imagery, and census variables. The LLM then produces a simulated human response, like “light shaking, no damage,” along with an MMI rating. These are compared to real reports from the 2014 Napa and 2019 Ridgecrest earthquakes.
The results are actually surprisingly strong.
The best-performing models show high correlations between their predicted MMI scores and real-world responses from the USGS “Did You Feel It?” survey. Interestingly, Google Street View contributed more to accuracy than structured data like building counts or income. The LLMs clearly internalised core patterns, such as shaking decreasing with distance from the epicentre. Some models also displayed distinct reasoning styles: one focused on environmental cues like vegetation and street layout, while another emphasised technical terms related to building compliance and seismic risk.
Of course, there are clear limitations. It relies heavily on US-based data and Street View coverage, but it offers a compelling look at how LLMs might support pre-event planning with human-centric risk estimates.
3. A new method of mapping roads
In theory, extracting road networks from satellite imagery sounds simple. Just find the roads and draw the lines. But most models struggle with disconnections, missing links, and messy intersections.
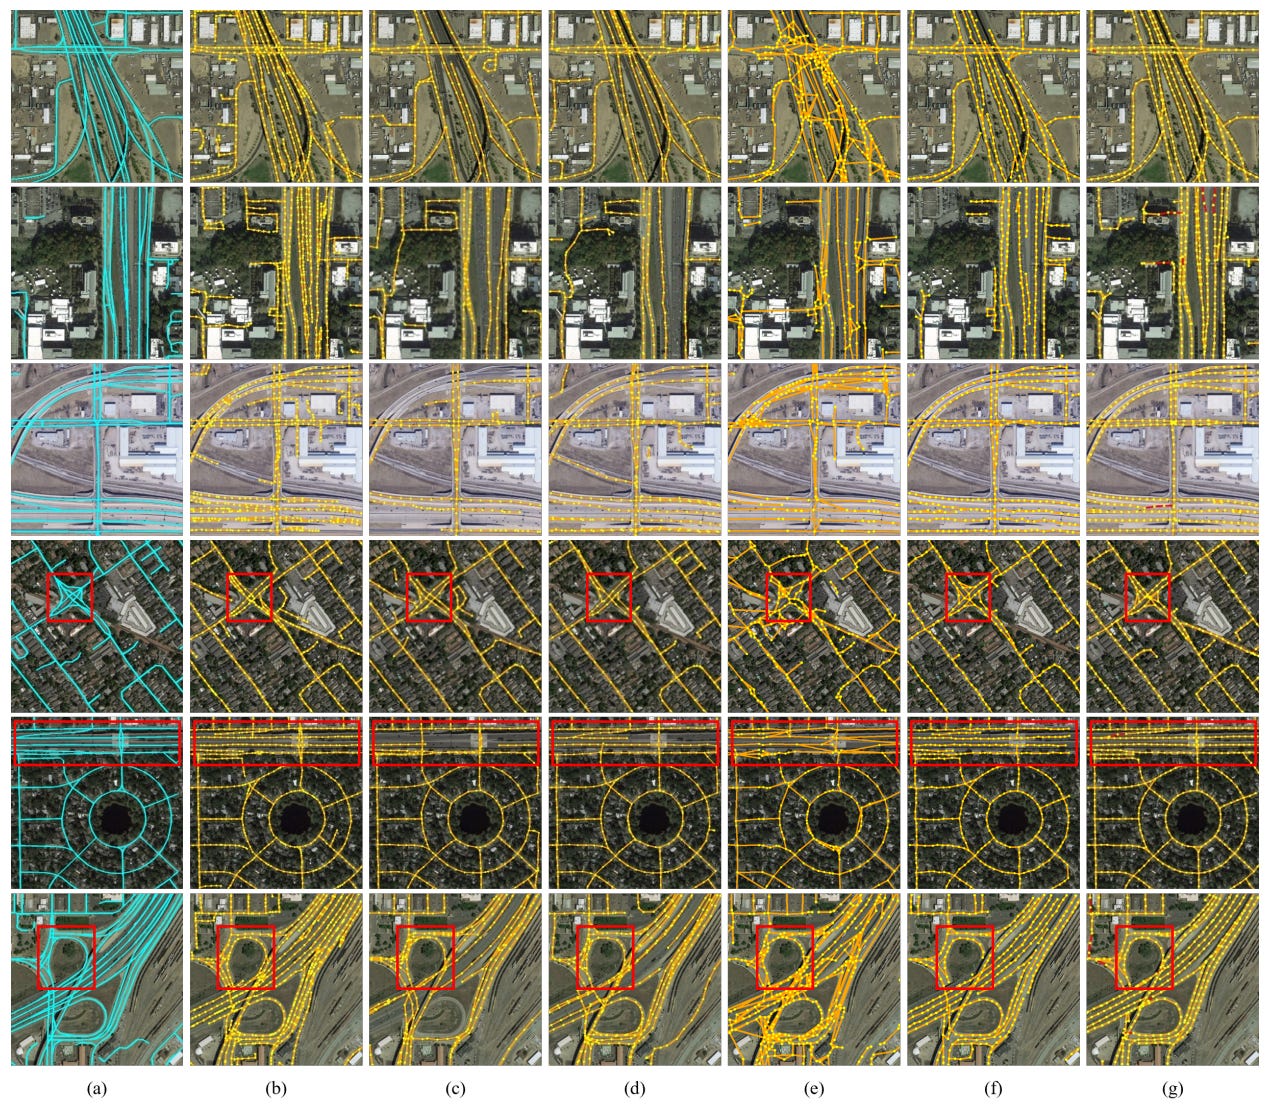
A new paper introduces GLD-Road, to try and fix this.
It splits the task into two stages: a global decoder to build the broad network structure, followed by a local decoder that fine-tunes tricky areas like intersections or dead ends. This structure helps it balance precision and coverage, producing cleaner, more connected results. It also uses directional descriptors and a denoising module to reduce false positives and fix gaps.
The model was tested on two standard datasets: City-Scale and SpaceNet3 and came out ahead across nearly all metrics. It achieved higher TOPO-F1 and APLS scores than previous methods, with faster inference times. In complex areas like ring roads or dense urban junctions, GLD-Road’s predictions were far closer to the ground truth. Even the first-stage output, before any local refinement, already outperformed several full models in terms of accuracy and speed.
However, GLD-Road isn’t perfect. It struggles with overpasses, and the training process is heavy, taking nearly three days on multiple GPUs. But, in any case, it shows that splitting the task into global and local stages, and focusing on structural connectivity, can lead to much stronger results.
You can check out the experimental results here.
4. GeoPandas now has an AI copilot built into your data

Many AI coding tools sit outside your data environment. They don’t understand your schema, projection system, or the quirks of geospatial analysis.
GeoPandas-AI, on the other hand, extends the standard GeoDataFrame with a conversational interface, letting you send natural language prompts like “Plot the network” and receive working code in return. You can refine the output step by step using functions like .improve() and then save the result as a reusable Python function with .inject().
What makes this tool different is how it handles context. It reads your dataset’s schema, CRS, and summary statistics, and combines that with any description you give (for example, “OSM parks in Berlin with accessibility info”). This helps avoid a bunch of common errors, such as invalid joins or incorrect projections. The underlying language model uses only metadata and optional data samples, so your data stays private by default. There’s also a caching mechanism to improve speed and reproducibility across sessions.
GeoPandas-AI performs particularly well on domain-specific tasks thanks to a backend enhanced with geospatial examples. In testing, it produced accurate and usable code with fewer steps compared to general-purpose copilots. The project is open source and available on PyPI.
Geospatial Datasets
1. Comprehensive global building data
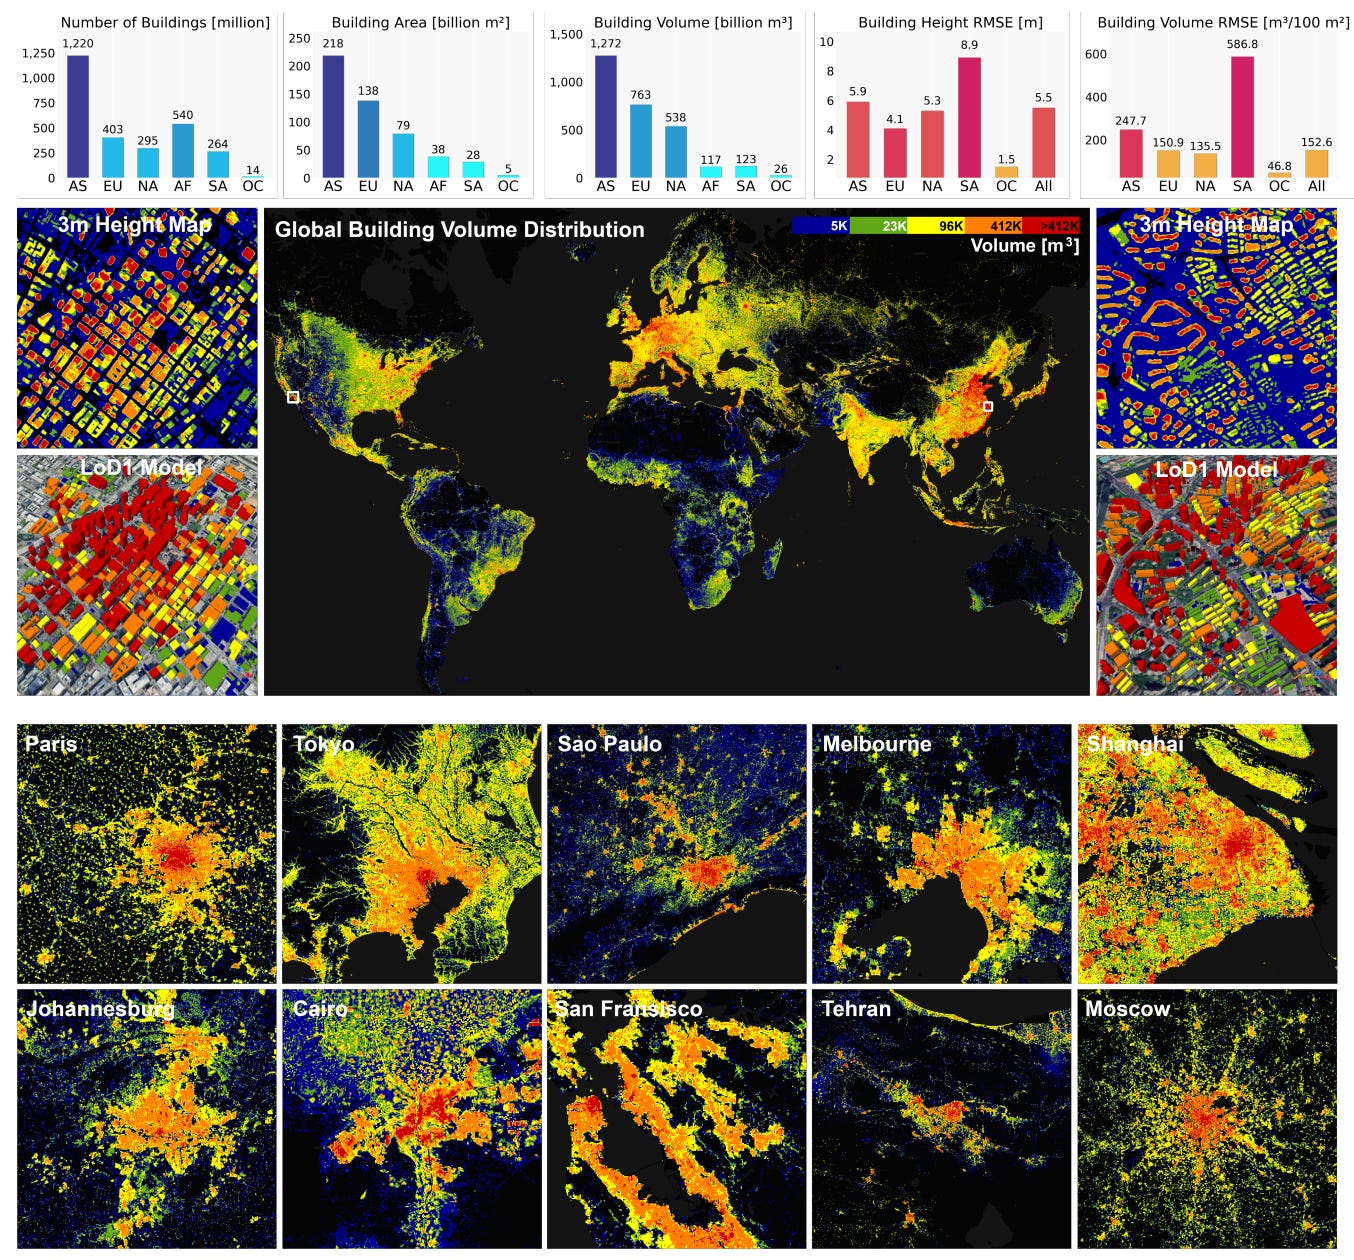
GlobalBuildingAtlas (GBA) is a newly released, open-source dataset that provides comprehensive global building data, including 2D polygons, 3D heights, and Level of Detail 1 (LoD1) 3D models. It surpasses existing datasets by offering more than 2.75 billion building instances globally. You can access the code here. The data will be available on mediaTUM.
2. Tree cover loss data
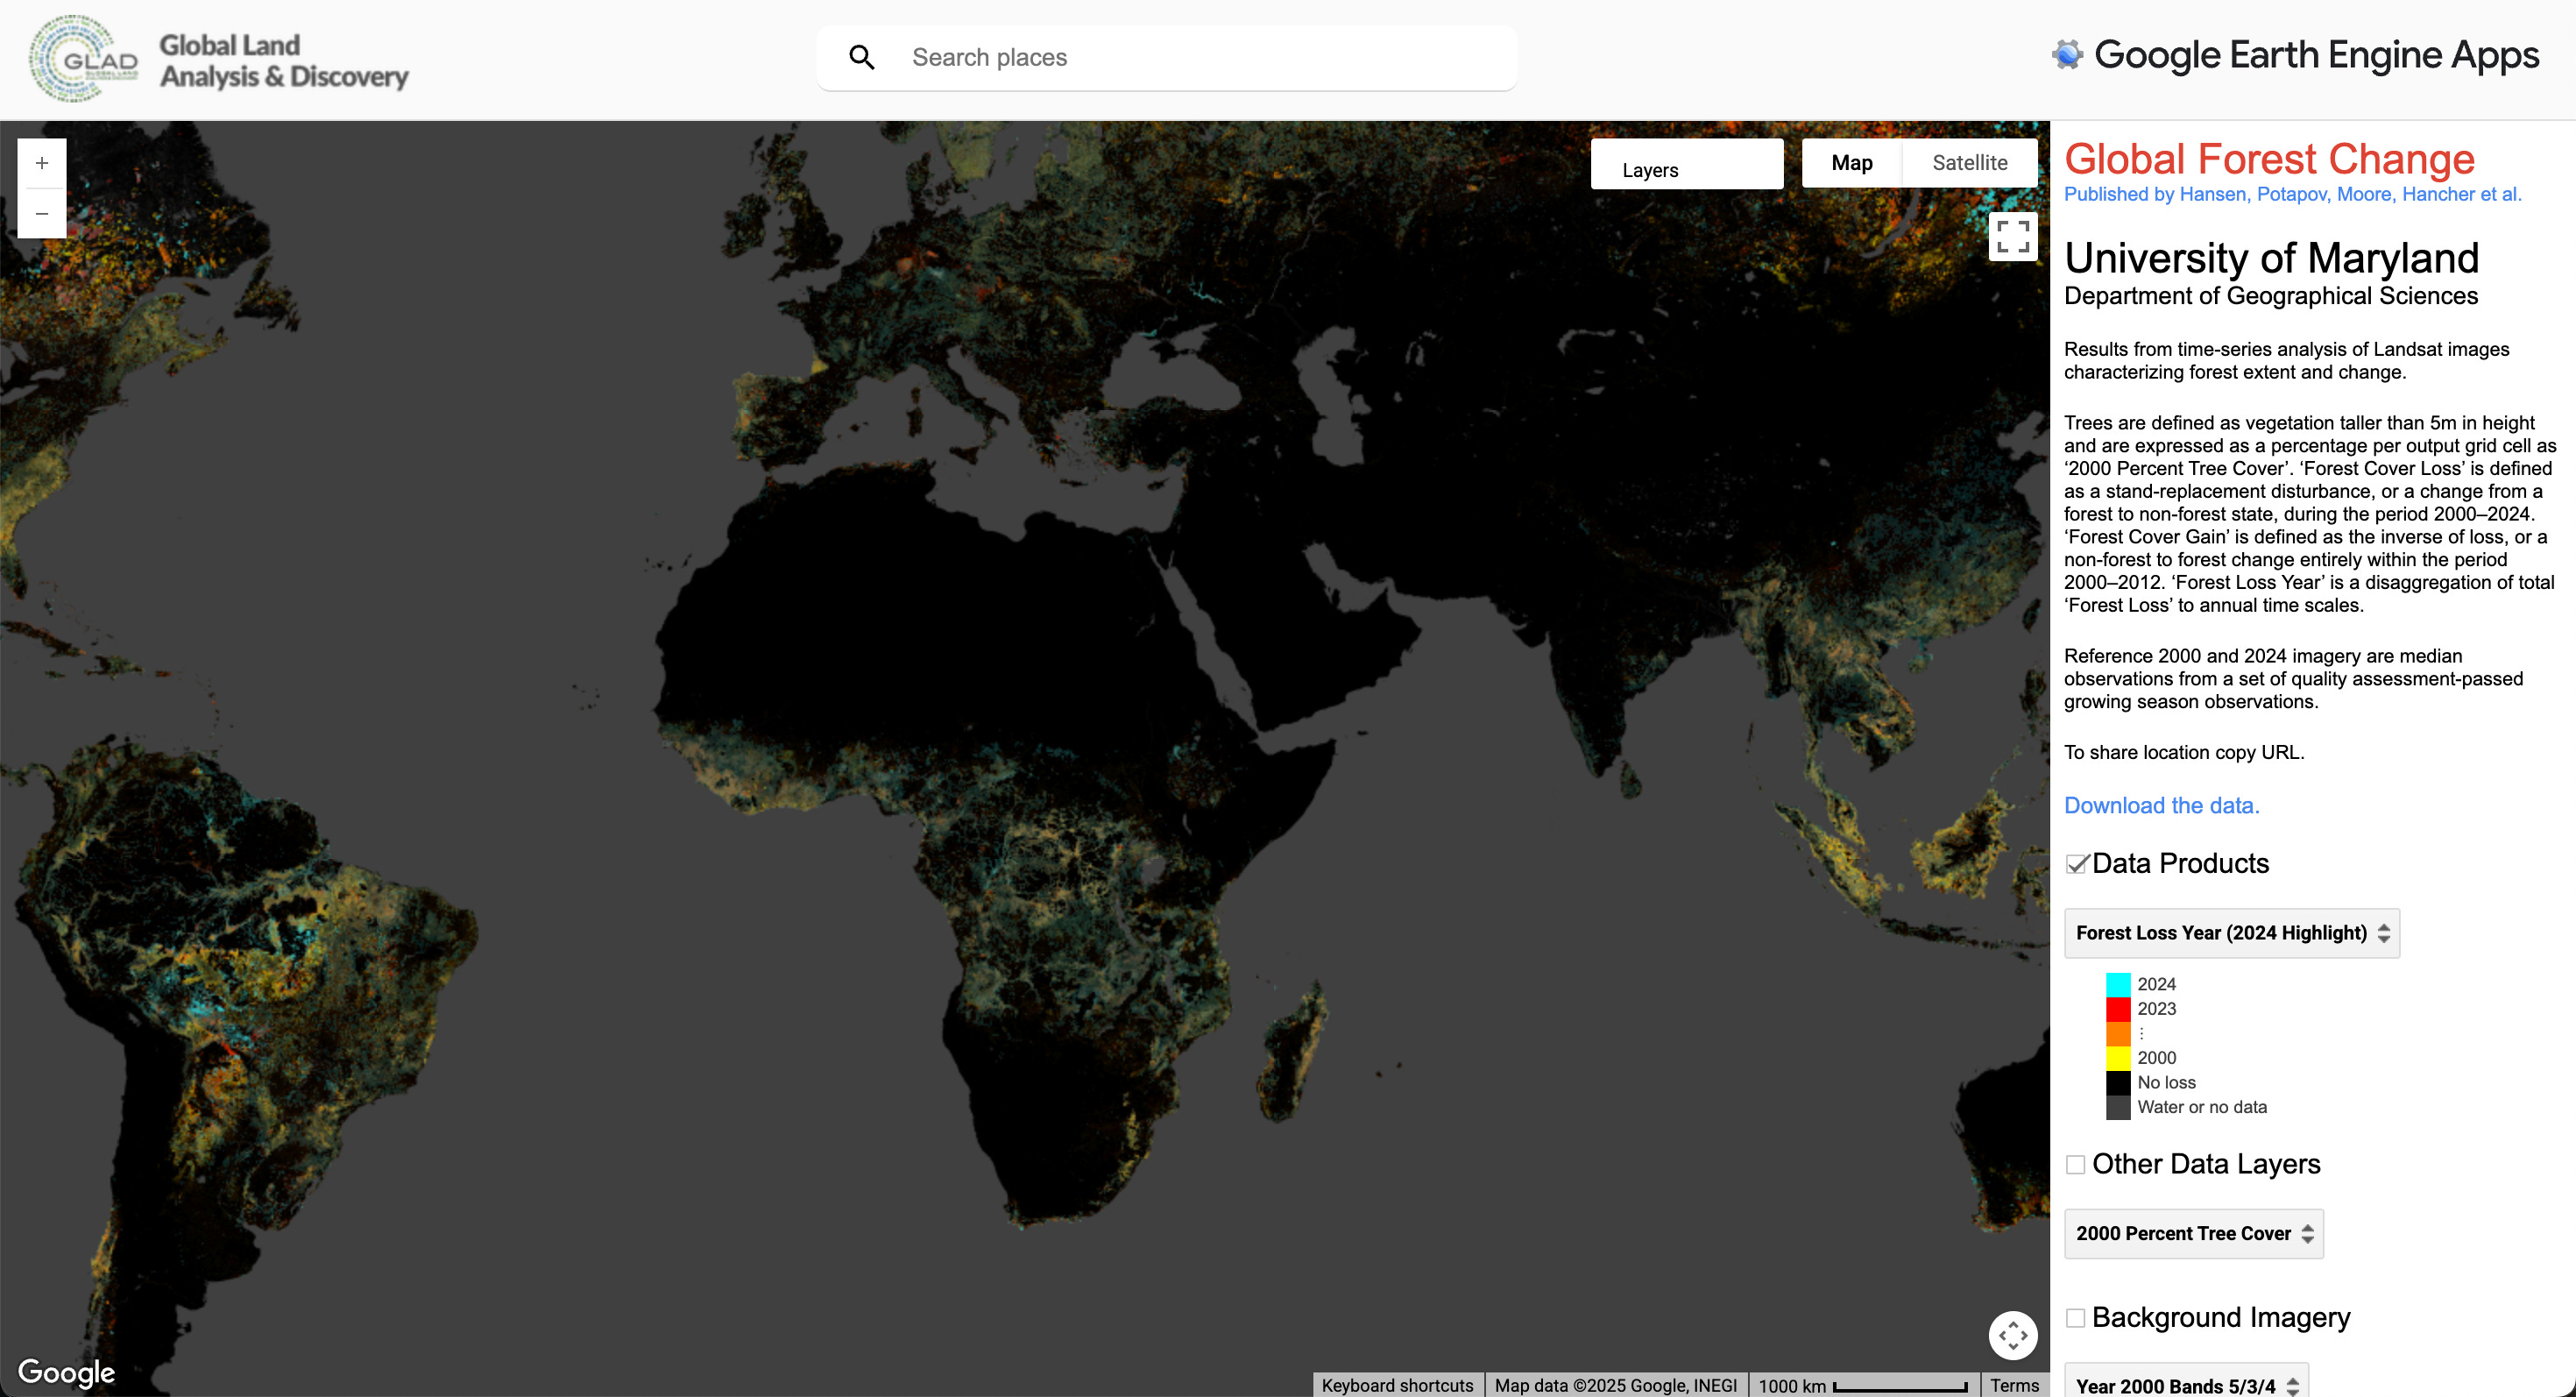
The latest update from UMD’s GLAD Lab provides annual tree cover loss data from 2000 to 2024 using time-series Landsat imagery at 30 m resolution. You can access the data here or here.
3. Global lakes and wetlands database
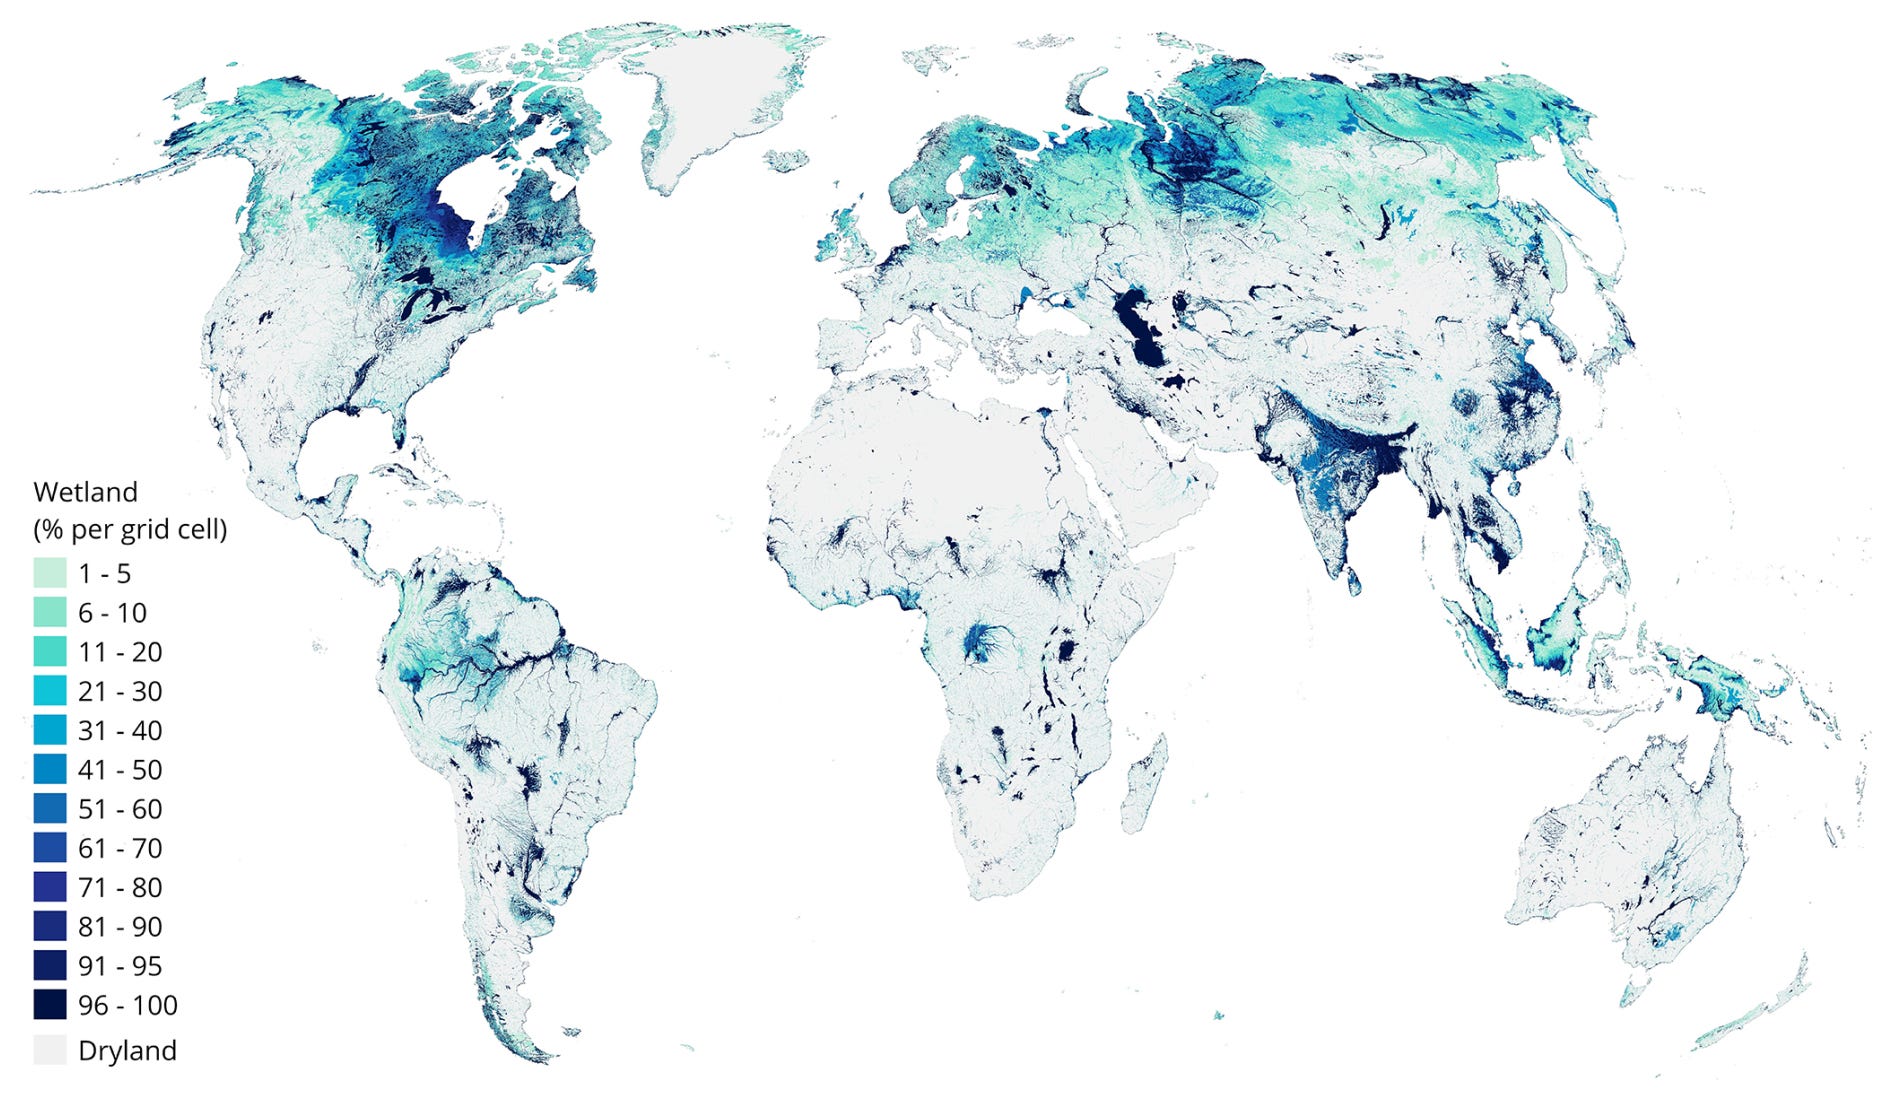
GLWD v2 is a global 500 m resolution map of inland and coastal wetland ecosystems covering ∼13.4% of Earth’s land area (excl. Antarctica). It classifies 33 wetland types, ranging from freshwater lakes and peatlands to rice paddies and salt marshes. It uses over 25 datasets spanning 1984–2020. You can access the data here or here.
4. Yet another global tree cover loss dataset
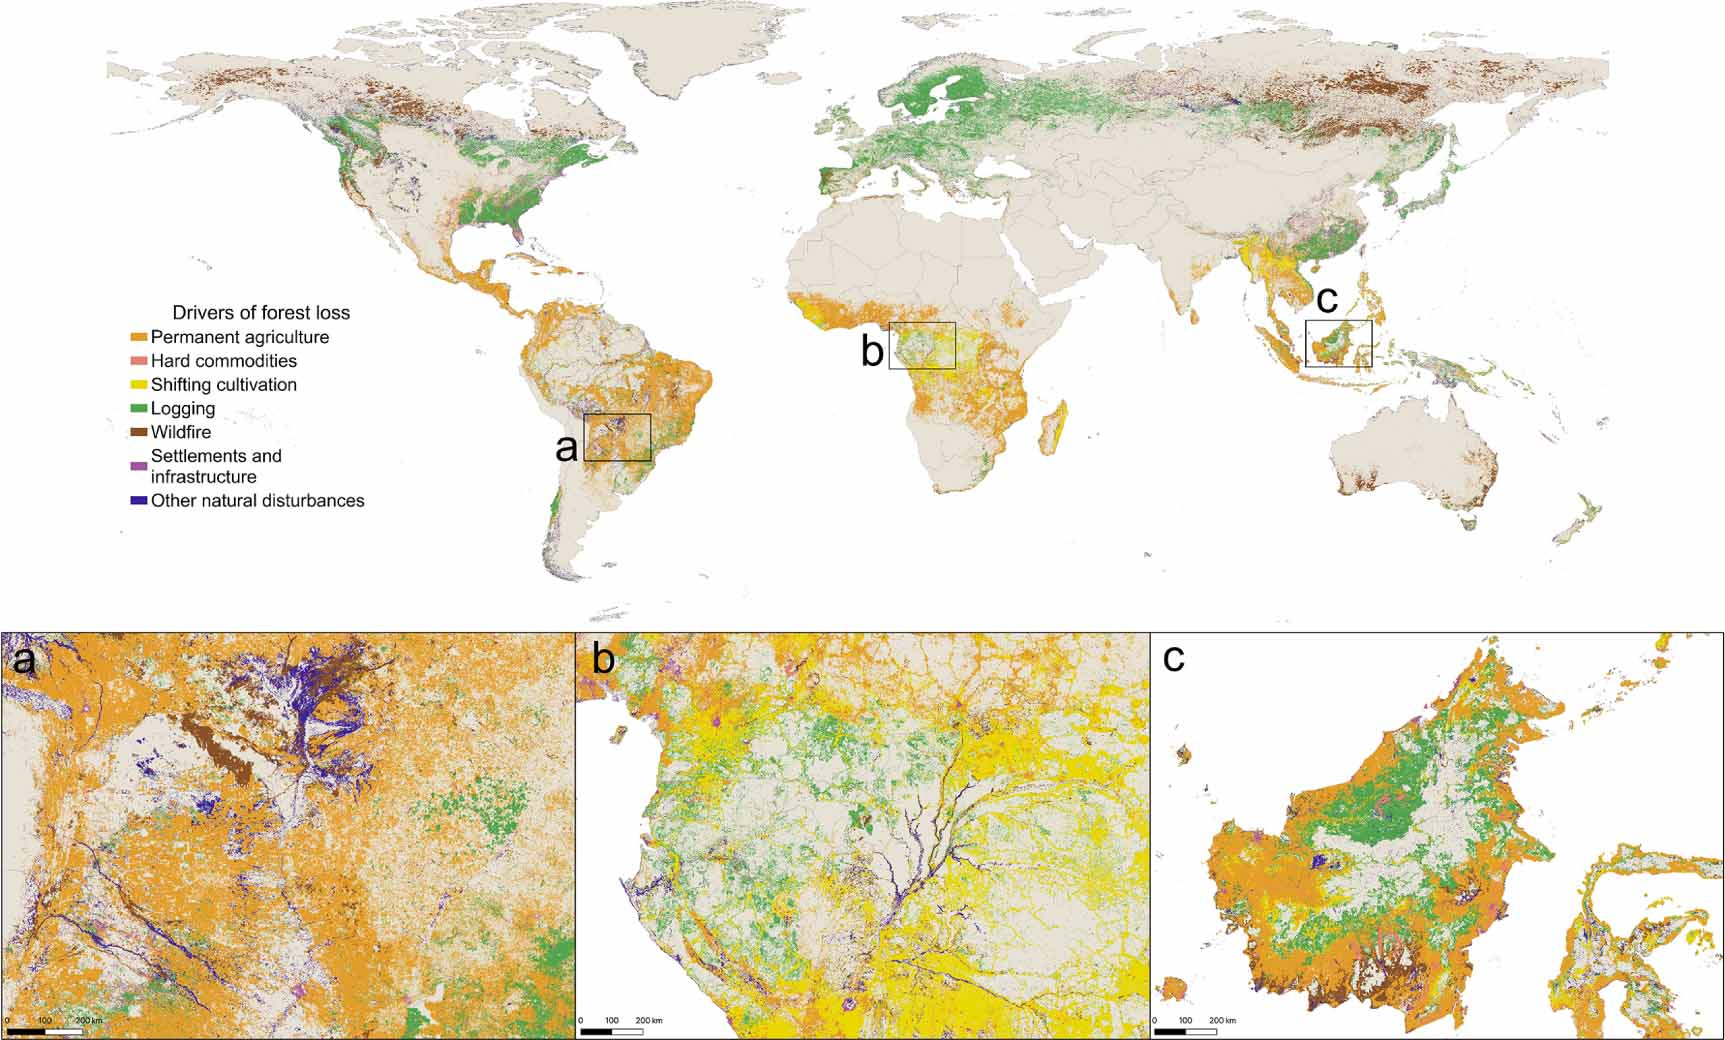
You tree loss enthusiasts are in luck this week. There’s another new dataset maps the drivers of global tree cover loss using a custom ResNet model trained on high-res satellite imagery. It classifies seven categories including agriculture, mining, logging, and wildfire; by combining Landsat, Sentinel-2, and ancillary data. You can access the data on various platforms: GEE, WRI, Global Forest Watch, and Zenodo.
Other useful bits

The World Bank has updated its country income classifications for FY2026, using 2024 GNI per capita data. Costa Rica joined the high-income group, while Cabo Verde and Samoa moved up to upper-middle. Namibia, however, dropped a tier due to slower growth and revised population data. These shifts reflect broader economic trends and help guide development aid, policy focus, and global comparisons.
The World Bank also found that by 2030, fragile and conflict-affected countries are expected to account for nearly 60% of the world’s extreme poor. These countries are grappling with overlapping crises: rising conflict, poverty, hunger, and strained public services.
The Library of Congress has launched a new Geospatial Software and File Formats Web Archive to preserve documentation on tools like shapefiles, GeoDa, and early GIS software. I guess you can think of it as a time capsule for modern mapmaking.
A new study from Aalto University used 20+ years of NASA satellite data to track how peatland restoration affects climate variables. Restored sites began resembling intact peatlands in terms of temperature and albedo within a decade, though vegetation recovery was slower.
Jobs
Médecins Sans Frontières (MSF) is looking for a Head of GIS Products based in Geneva, Switzerland
UN-Habitat - United Nations Human Settlements Programme is looking for a Junior Nature-based Solutions and Climate Consultant based in Nairobi, Kenya
FAO - Food and Agriculture Organization of the United Nations is looking for a Software Solutions Developer based in Georgetown, Guyana
World Resources Institute (WRI) is looking for an Agricultural Analysis Intern based in Washington DC, USA
Mapbox is looking for a Software Development Engineer based in the United States.
Just for Fun

A strange fast radio burst (FRB) detected in 2024 turned out to come from Relay 2, a NASA satellite decommissioned in 1967. This signal most likely came from an electrostatic discharge triggered by space debris or plasma buildup.
I guess even dead satellites can produce sudden bursts of energy...
That’s it for this week.
I’m always keen to hear from you, so please let me know if you have:
new geospatial datasets
newly published papers
geospatial job opportunities
and I’ll do my best to showcase them here.
Yohan